Asian vs Lumbee Married-Couple Family Poverty
COMPARE
Asian
Lumbee
Married-Couple Family Poverty
Married-Couple Family Poverty Comparison
Asians
Lumbee
4.7%
MARRIED-COUPLE FAMILY POVERTY
97.6/ 100
METRIC RATING
102nd/ 347
METRIC RANK
8.3%
MARRIED-COUPLE FAMILY POVERTY
0.0/ 100
METRIC RATING
333rd/ 347
METRIC RANK
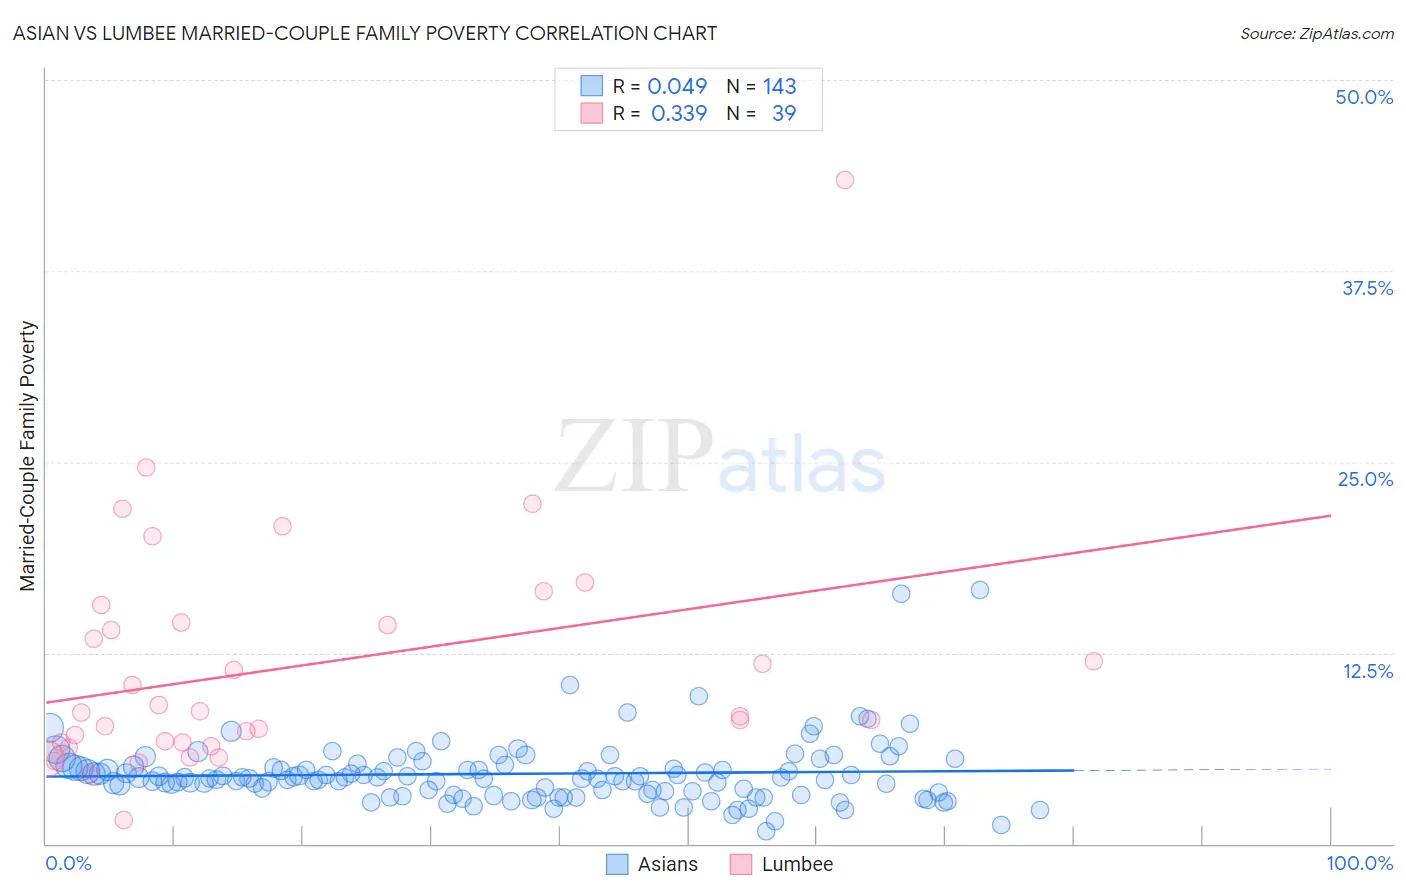
Asian vs Lumbee Married-Couple Family Poverty Correlation Chart
The statistical analysis conducted on geographies consisting of 539,455,145 people shows no correlation between the proportion of Asians and poverty level among married-couple families in the United States with a correlation coefficient (R) of 0.049 and weighted average of 4.7%. Similarly, the statistical analysis conducted on geographies consisting of 92,019,006 people shows a mild positive correlation between the proportion of Lumbee and poverty level among married-couple families in the United States with a correlation coefficient (R) of 0.339 and weighted average of 8.3%, a difference of 79.0%.
Married-Couple Family Poverty Correlation Summary
| Measurement | Asian | Lumbee |
| Minimum | 0.82% | 1.5% |
| Maximum | 16.6% | 43.5% |
| Range | 15.8% | 41.9% |
| Mean | 4.6% | 11.6% |
| Median | 4.3% | 8.6% |
| Interquartile 25% (IQ1) | 3.3% | 6.6% |
| Interquartile 75% (IQ3) | 5.1% | 14.5% |
| Interquartile Range (IQR) | 1.7% | 7.9% |
| Standard Deviation (Sample) | 2.1% | 7.7% |
| Standard Deviation (Population) | 2.1% | 7.6% |
Similar Demographics by Married-Couple Family Poverty
Demographics Similar to Asians by Married-Couple Family Poverty
In terms of married-couple family poverty, the demographic groups most similar to Asians are Immigrants from Romania (4.7%, a difference of 0.29%), Yugoslavian (4.6%, a difference of 0.40%), Immigrants from Western Europe (4.6%, a difference of 0.42%), Immigrants from Europe (4.6%, a difference of 0.53%), and Immigrants from Moldova (4.7%, a difference of 0.63%).
| Demographics | Rating | Rank | Married-Couple Family Poverty |
| Portuguese | 98.3 /100 | #95 | Exceptional 4.6% |
| Immigrants | Poland | 98.3 /100 | #96 | Exceptional 4.6% |
| Immigrants | Belgium | 98.2 /100 | #97 | Exceptional 4.6% |
| Native Hawaiians | 98.0 /100 | #98 | Exceptional 4.6% |
| Immigrants | Europe | 97.9 /100 | #99 | Exceptional 4.6% |
| Immigrants | Western Europe | 97.9 /100 | #100 | Exceptional 4.6% |
| Yugoslavians | 97.8 /100 | #101 | Exceptional 4.6% |
| Asians | 97.6 /100 | #102 | Exceptional 4.7% |
| Immigrants | Romania | 97.3 /100 | #103 | Exceptional 4.7% |
| Immigrants | Moldova | 97.1 /100 | #104 | Exceptional 4.7% |
| Aleuts | 97.0 /100 | #105 | Exceptional 4.7% |
| Immigrants | France | 96.9 /100 | #106 | Exceptional 4.7% |
| Immigrants | Germany | 96.8 /100 | #107 | Exceptional 4.7% |
| Laotians | 96.6 /100 | #108 | Exceptional 4.7% |
| Immigrants | Hong Kong | 96.4 /100 | #109 | Exceptional 4.7% |
Demographics Similar to Lumbee by Married-Couple Family Poverty
In terms of married-couple family poverty, the demographic groups most similar to Lumbee are Dominican (8.3%, a difference of 0.47%), Central American Indian (8.3%, a difference of 0.53%), Paiute (8.3%, a difference of 0.59%), Immigrants from Dominican Republic (8.4%, a difference of 0.68%), and Native/Alaskan (8.2%, a difference of 1.9%).
| Demographics | Rating | Rank | Married-Couple Family Poverty |
| Immigrants | Bangladesh | 0.0 /100 | #326 | Tragic 7.5% |
| Hispanics or Latinos | 0.0 /100 | #327 | Tragic 7.5% |
| Immigrants | Mexico | 0.0 /100 | #328 | Tragic 7.6% |
| Natives/Alaskans | 0.0 /100 | #329 | Tragic 8.2% |
| Paiute | 0.0 /100 | #330 | Tragic 8.3% |
| Central American Indians | 0.0 /100 | #331 | Tragic 8.3% |
| Dominicans | 0.0 /100 | #332 | Tragic 8.3% |
| Lumbee | 0.0 /100 | #333 | Tragic 8.3% |
| Immigrants | Dominican Republic | 0.0 /100 | #334 | Tragic 8.4% |
| Sioux | 0.0 /100 | #335 | Tragic 8.7% |
| Apache | 0.0 /100 | #336 | Tragic 9.0% |
| Yakama | 0.0 /100 | #337 | Tragic 9.0% |
| Cheyenne | 0.0 /100 | #338 | Tragic 9.4% |
| Crow | 0.0 /100 | #339 | Tragic 9.6% |
| Yuman | 0.0 /100 | #340 | Tragic 9.7% |