Welsh vs Spanish American Indian Married-Couple Family Poverty
COMPARE
Welsh
Spanish American Indian
Married-Couple Family Poverty
Married-Couple Family Poverty Comparison
Welsh
Spanish American Indians
4.3%
MARRIED-COUPLE FAMILY POVERTY
99.7/ 100
METRIC RATING
53rd/ 347
METRIC RANK
7.1%
MARRIED-COUPLE FAMILY POVERTY
0.0/ 100
METRIC RATING
308th/ 347
METRIC RANK
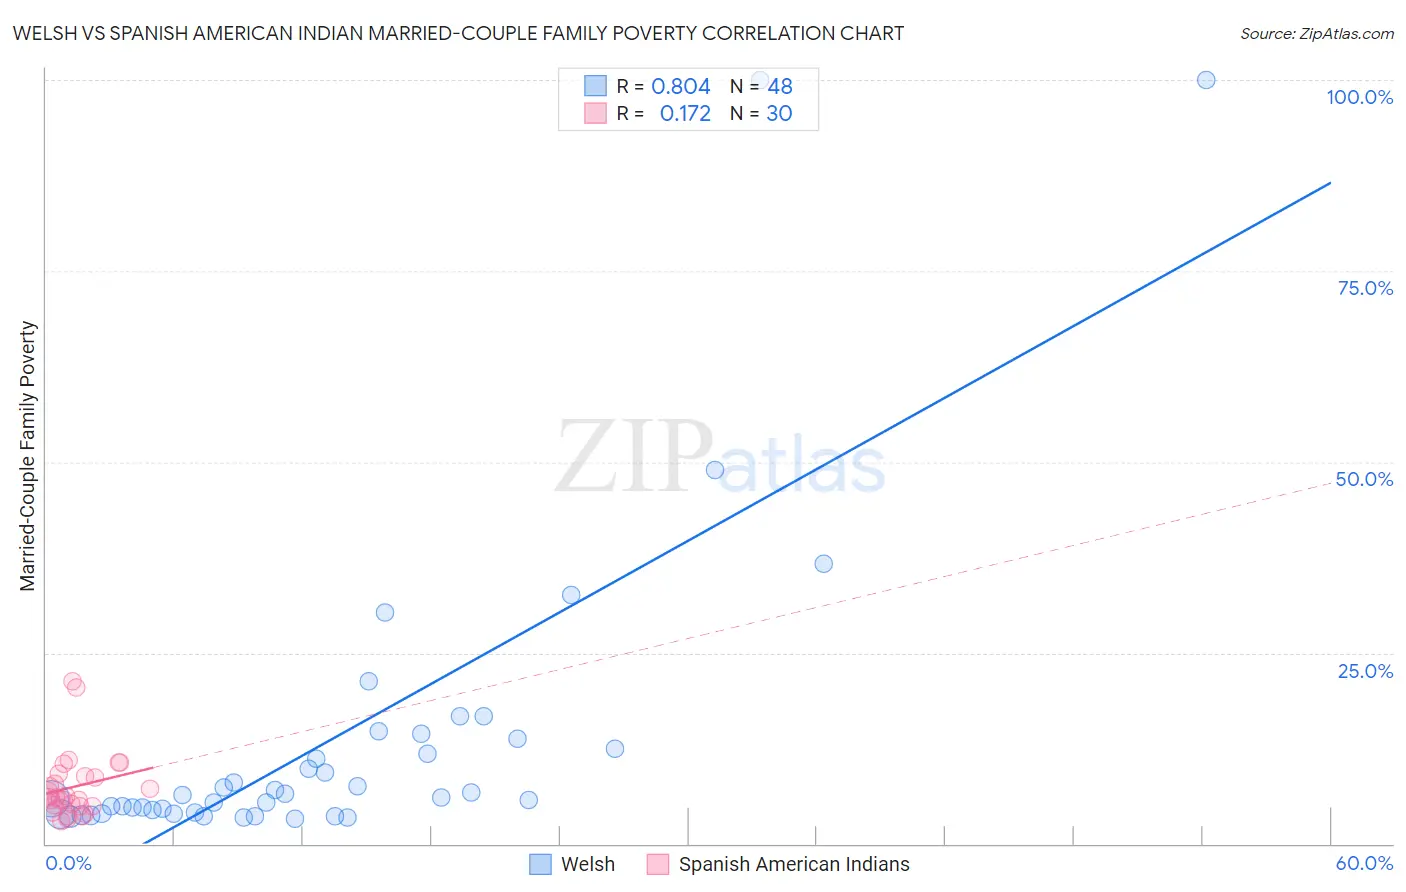
Welsh vs Spanish American Indian Married-Couple Family Poverty Correlation Chart
The statistical analysis conducted on geographies consisting of 518,114,778 people shows a very strong positive correlation between the proportion of Welsh and poverty level among married-couple families in the United States with a correlation coefficient (R) of 0.804 and weighted average of 4.3%. Similarly, the statistical analysis conducted on geographies consisting of 73,069,372 people shows a poor positive correlation between the proportion of Spanish American Indians and poverty level among married-couple families in the United States with a correlation coefficient (R) of 0.172 and weighted average of 7.1%, a difference of 62.9%.
Married-Couple Family Poverty Correlation Summary
| Measurement | Welsh | Spanish American Indian |
| Minimum | 3.3% | 3.0% |
| Maximum | 100.0% | 21.3% |
| Range | 96.7% | 18.4% |
| Mean | 13.6% | 7.4% |
| Median | 6.3% | 6.0% |
| Interquartile 25% (IQ1) | 4.1% | 5.0% |
| Interquartile 75% (IQ3) | 13.2% | 8.9% |
| Interquartile Range (IQR) | 9.1% | 3.9% |
| Standard Deviation (Sample) | 20.5% | 4.3% |
| Standard Deviation (Population) | 20.3% | 4.3% |
Similar Demographics by Married-Couple Family Poverty
Demographics Similar to Welsh by Married-Couple Family Poverty
In terms of married-couple family poverty, the demographic groups most similar to Welsh are Russian (4.3%, a difference of 0.15%), Immigrants from Lithuania (4.3%, a difference of 0.18%), Burmese (4.3%, a difference of 0.19%), Austrian (4.3%, a difference of 0.26%), and Turkish (4.3%, a difference of 0.29%).
| Demographics | Rating | Rank | Married-Couple Family Poverty |
| British | 99.8 /100 | #46 | Exceptional 4.3% |
| Immigrants | South Central Asia | 99.8 /100 | #47 | Exceptional 4.3% |
| Australians | 99.7 /100 | #48 | Exceptional 4.3% |
| Turks | 99.7 /100 | #49 | Exceptional 4.3% |
| Burmese | 99.7 /100 | #50 | Exceptional 4.3% |
| Immigrants | Lithuania | 99.7 /100 | #51 | Exceptional 4.3% |
| Russians | 99.7 /100 | #52 | Exceptional 4.3% |
| Welsh | 99.7 /100 | #53 | Exceptional 4.3% |
| Austrians | 99.7 /100 | #54 | Exceptional 4.3% |
| French | 99.7 /100 | #55 | Exceptional 4.3% |
| Immigrants | Zimbabwe | 99.7 /100 | #56 | Exceptional 4.3% |
| Immigrants | Netherlands | 99.7 /100 | #57 | Exceptional 4.3% |
| Czechoslovakians | 99.7 /100 | #58 | Exceptional 4.4% |
| Immigrants | Sweden | 99.6 /100 | #59 | Exceptional 4.4% |
| Tlingit-Haida | 99.6 /100 | #60 | Exceptional 4.4% |
Demographics Similar to Spanish American Indians by Married-Couple Family Poverty
In terms of married-couple family poverty, the demographic groups most similar to Spanish American Indians are Guatemalan (7.0%, a difference of 0.18%), Hopi (7.1%, a difference of 0.60%), Immigrants from Nicaragua (7.1%, a difference of 0.62%), Immigrants from Dominica (7.1%, a difference of 0.68%), and Immigrants from Armenia (7.1%, a difference of 0.68%).
| Demographics | Rating | Rank | Married-Couple Family Poverty |
| Central Americans | 0.0 /100 | #301 | Tragic 6.7% |
| Immigrants | Ecuador | 0.0 /100 | #302 | Tragic 6.7% |
| Immigrants | El Salvador | 0.0 /100 | #303 | Tragic 6.8% |
| Cubans | 0.0 /100 | #304 | Tragic 6.8% |
| Haitians | 0.0 /100 | #305 | Tragic 6.8% |
| Immigrants | Haiti | 0.0 /100 | #306 | Tragic 7.0% |
| Guatemalans | 0.0 /100 | #307 | Tragic 7.0% |
| Spanish American Indians | 0.0 /100 | #308 | Tragic 7.1% |
| Hopi | 0.0 /100 | #309 | Tragic 7.1% |
| Immigrants | Nicaragua | 0.0 /100 | #310 | Tragic 7.1% |
| Immigrants | Dominica | 0.0 /100 | #311 | Tragic 7.1% |
| Immigrants | Armenia | 0.0 /100 | #312 | Tragic 7.1% |
| Immigrants | St. Vincent and the Grenadines | 0.0 /100 | #313 | Tragic 7.1% |
| British West Indians | 0.0 /100 | #314 | Tragic 7.1% |
| Inupiat | 0.0 /100 | #315 | Tragic 7.1% |