Tohono O'odham vs Lumbee Married-Couple Family Poverty
COMPARE
Tohono O'odham
Lumbee
Married-Couple Family Poverty
Married-Couple Family Poverty Comparison
Tohono O'odham
Lumbee
11.2%
MARRIED-COUPLE FAMILY POVERTY
0.0/ 100
METRIC RATING
342nd/ 347
METRIC RANK
8.3%
MARRIED-COUPLE FAMILY POVERTY
0.0/ 100
METRIC RATING
333rd/ 347
METRIC RANK
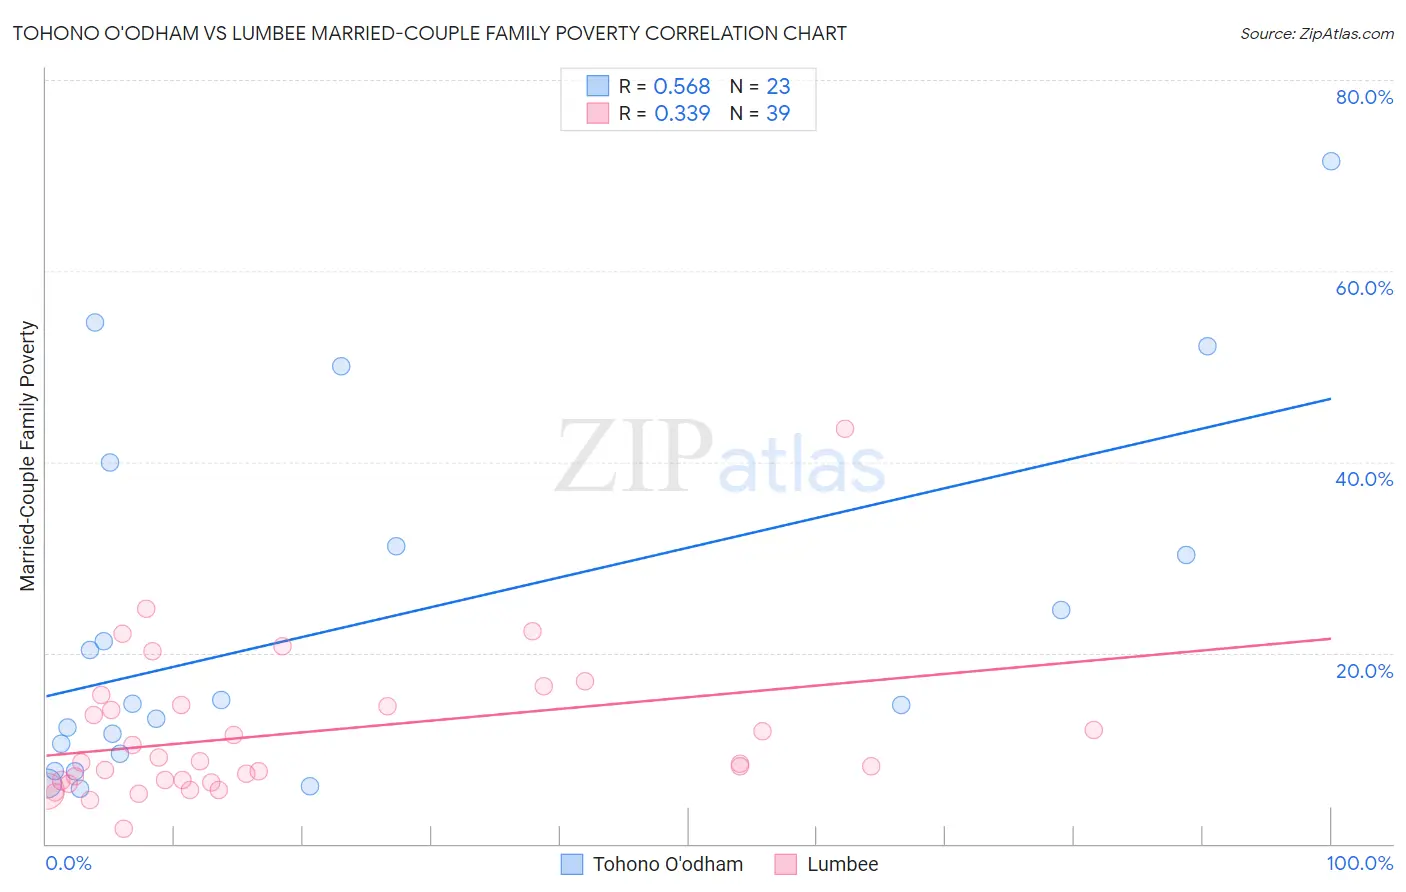
Tohono O'odham vs Lumbee Married-Couple Family Poverty Correlation Chart
The statistical analysis conducted on geographies consisting of 58,693,710 people shows a substantial positive correlation between the proportion of Tohono O'odham and poverty level among married-couple families in the United States with a correlation coefficient (R) of 0.568 and weighted average of 11.2%. Similarly, the statistical analysis conducted on geographies consisting of 92,019,006 people shows a mild positive correlation between the proportion of Lumbee and poverty level among married-couple families in the United States with a correlation coefficient (R) of 0.339 and weighted average of 8.3%, a difference of 34.5%.
Married-Couple Family Poverty Correlation Summary
| Measurement | Tohono O'odham | Lumbee |
| Minimum | 5.8% | 1.5% |
| Maximum | 71.6% | 43.5% |
| Range | 65.8% | 41.9% |
| Mean | 23.0% | 11.6% |
| Median | 14.7% | 8.6% |
| Interquartile 25% (IQ1) | 9.4% | 6.6% |
| Interquartile 75% (IQ3) | 31.2% | 14.5% |
| Interquartile Range (IQR) | 21.8% | 7.9% |
| Standard Deviation (Sample) | 18.6% | 7.7% |
| Standard Deviation (Population) | 18.2% | 7.6% |
Demographics Similar to Tohono O'odham and Lumbee by Married-Couple Family Poverty
In terms of married-couple family poverty, the demographic groups most similar to Tohono O'odham are Pueblo (11.1%, a difference of 0.93%), Pima (11.4%, a difference of 1.7%), Navajo (11.9%, a difference of 5.6%), Puerto Rican (12.6%, a difference of 12.6%), and Immigrants from Yemen (12.8%, a difference of 14.1%). Similarly, the demographic groups most similar to Lumbee are Dominican (8.3%, a difference of 0.47%), Central American Indian (8.3%, a difference of 0.53%), Paiute (8.3%, a difference of 0.59%), Immigrants from Dominican Republic (8.4%, a difference of 0.68%), and Native/Alaskan (8.2%, a difference of 1.9%).
| Demographics | Rating | Rank | Married-Couple Family Poverty |
| Hispanics or Latinos | 0.0 /100 | #327 | Tragic 7.5% |
| Immigrants | Mexico | 0.0 /100 | #328 | Tragic 7.6% |
| Natives/Alaskans | 0.0 /100 | #329 | Tragic 8.2% |
| Paiute | 0.0 /100 | #330 | Tragic 8.3% |
| Central American Indians | 0.0 /100 | #331 | Tragic 8.3% |
| Dominicans | 0.0 /100 | #332 | Tragic 8.3% |
| Lumbee | 0.0 /100 | #333 | Tragic 8.3% |
| Immigrants | Dominican Republic | 0.0 /100 | #334 | Tragic 8.4% |
| Sioux | 0.0 /100 | #335 | Tragic 8.7% |
| Apache | 0.0 /100 | #336 | Tragic 9.0% |
| Yakama | 0.0 /100 | #337 | Tragic 9.0% |
| Cheyenne | 0.0 /100 | #338 | Tragic 9.4% |
| Crow | 0.0 /100 | #339 | Tragic 9.6% |
| Yuman | 0.0 /100 | #340 | Tragic 9.7% |
| Pueblo | 0.0 /100 | #341 | Tragic 11.1% |
| Tohono O'odham | 0.0 /100 | #342 | Tragic 11.2% |
| Pima | 0.0 /100 | #343 | Tragic 11.4% |
| Navajo | 0.0 /100 | #344 | Tragic 11.9% |
| Puerto Ricans | 0.0 /100 | #345 | Tragic 12.6% |
| Immigrants | Yemen | 0.0 /100 | #346 | Tragic 12.8% |
| Yup'ik | 0.0 /100 | #347 | Tragic 13.4% |