Syrian vs Lumbee Married-Couple Family Poverty
COMPARE
Syrian
Lumbee
Married-Couple Family Poverty
Married-Couple Family Poverty Comparison
Syrians
Lumbee
5.0%
MARRIED-COUPLE FAMILY POVERTY
78.7/ 100
METRIC RATING
147th/ 347
METRIC RANK
8.3%
MARRIED-COUPLE FAMILY POVERTY
0.0/ 100
METRIC RATING
333rd/ 347
METRIC RANK
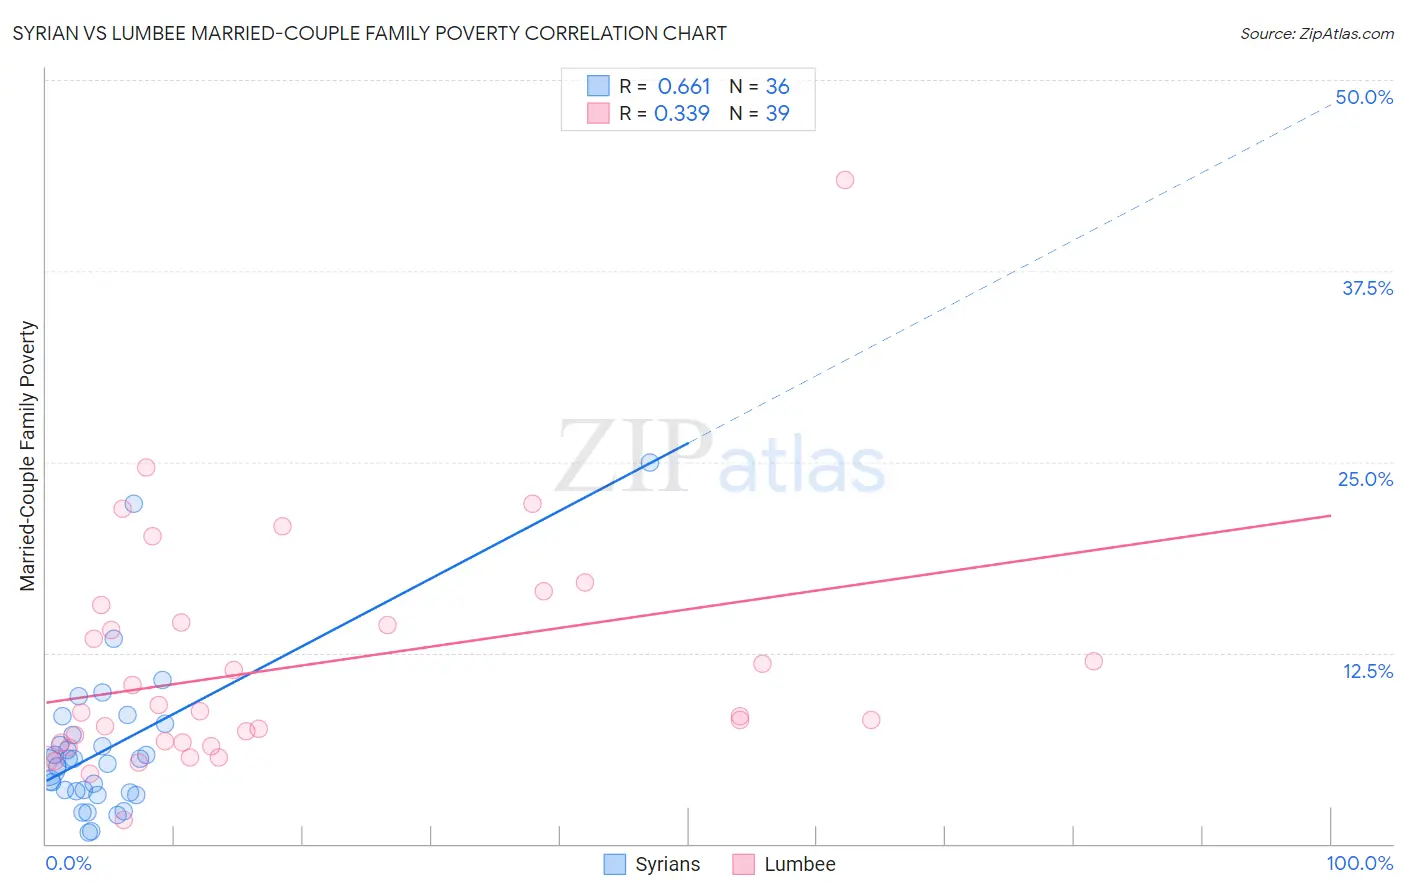
Syrian vs Lumbee Married-Couple Family Poverty Correlation Chart
The statistical analysis conducted on geographies consisting of 264,506,775 people shows a significant positive correlation between the proportion of Syrians and poverty level among married-couple families in the United States with a correlation coefficient (R) of 0.661 and weighted average of 5.0%. Similarly, the statistical analysis conducted on geographies consisting of 92,019,006 people shows a mild positive correlation between the proportion of Lumbee and poverty level among married-couple families in the United States with a correlation coefficient (R) of 0.339 and weighted average of 8.3%, a difference of 66.2%.
Married-Couple Family Poverty Correlation Summary
| Measurement | Syrian | Lumbee |
| Minimum | 0.72% | 1.5% |
| Maximum | 25.0% | 43.5% |
| Range | 24.3% | 41.9% |
| Mean | 6.3% | 11.6% |
| Median | 5.4% | 8.6% |
| Interquartile 25% (IQ1) | 3.4% | 6.6% |
| Interquartile 75% (IQ3) | 7.5% | 14.5% |
| Interquartile Range (IQR) | 4.1% | 7.9% |
| Standard Deviation (Sample) | 5.1% | 7.7% |
| Standard Deviation (Population) | 5.0% | 7.6% |
Similar Demographics by Married-Couple Family Poverty
Demographics Similar to Syrians by Married-Couple Family Poverty
In terms of married-couple family poverty, the demographic groups most similar to Syrians are Immigrants from Russia (5.0%, a difference of 0.0%), Immigrants from Oceania (5.0%, a difference of 0.030%), Brazilian (5.0%, a difference of 0.080%), Mongolian (5.0%, a difference of 0.19%), and Immigrants from Spain (5.0%, a difference of 0.21%).
| Demographics | Rating | Rank | Married-Couple Family Poverty |
| Immigrants | Portugal | 84.8 /100 | #140 | Excellent 5.0% |
| Immigrants | Brazil | 84.6 /100 | #141 | Excellent 5.0% |
| Immigrants | China | 84.6 /100 | #142 | Excellent 5.0% |
| Immigrants | Egypt | 83.4 /100 | #143 | Excellent 5.0% |
| Hmong | 83.2 /100 | #144 | Excellent 5.0% |
| Immigrants | Spain | 79.9 /100 | #145 | Good 5.0% |
| Mongolians | 79.8 /100 | #146 | Good 5.0% |
| Syrians | 78.7 /100 | #147 | Good 5.0% |
| Immigrants | Russia | 78.7 /100 | #148 | Good 5.0% |
| Immigrants | Oceania | 78.6 /100 | #149 | Good 5.0% |
| Brazilians | 78.3 /100 | #150 | Good 5.0% |
| Immigrants | Cameroon | 77.3 /100 | #151 | Good 5.0% |
| Albanians | 77.2 /100 | #152 | Good 5.0% |
| Immigrants | Kuwait | 76.3 /100 | #153 | Good 5.0% |
| Delaware | 73.7 /100 | #154 | Good 5.1% |
Demographics Similar to Lumbee by Married-Couple Family Poverty
In terms of married-couple family poverty, the demographic groups most similar to Lumbee are Dominican (8.3%, a difference of 0.47%), Central American Indian (8.3%, a difference of 0.53%), Paiute (8.3%, a difference of 0.59%), Immigrants from Dominican Republic (8.4%, a difference of 0.68%), and Native/Alaskan (8.2%, a difference of 1.9%).
| Demographics | Rating | Rank | Married-Couple Family Poverty |
| Immigrants | Bangladesh | 0.0 /100 | #326 | Tragic 7.5% |
| Hispanics or Latinos | 0.0 /100 | #327 | Tragic 7.5% |
| Immigrants | Mexico | 0.0 /100 | #328 | Tragic 7.6% |
| Natives/Alaskans | 0.0 /100 | #329 | Tragic 8.2% |
| Paiute | 0.0 /100 | #330 | Tragic 8.3% |
| Central American Indians | 0.0 /100 | #331 | Tragic 8.3% |
| Dominicans | 0.0 /100 | #332 | Tragic 8.3% |
| Lumbee | 0.0 /100 | #333 | Tragic 8.3% |
| Immigrants | Dominican Republic | 0.0 /100 | #334 | Tragic 8.4% |
| Sioux | 0.0 /100 | #335 | Tragic 8.7% |
| Apache | 0.0 /100 | #336 | Tragic 9.0% |
| Yakama | 0.0 /100 | #337 | Tragic 9.0% |
| Cheyenne | 0.0 /100 | #338 | Tragic 9.4% |
| Crow | 0.0 /100 | #339 | Tragic 9.6% |
| Yuman | 0.0 /100 | #340 | Tragic 9.7% |