Welsh vs Afghan Married-Couple Family Poverty
COMPARE
Welsh
Afghan
Married-Couple Family Poverty
Married-Couple Family Poverty Comparison
Welsh
Afghans
4.3%
MARRIED-COUPLE FAMILY POVERTY
99.7/ 100
METRIC RATING
53rd/ 347
METRIC RANK
5.5%
MARRIED-COUPLE FAMILY POVERTY
11.2/ 100
METRIC RATING
218th/ 347
METRIC RANK
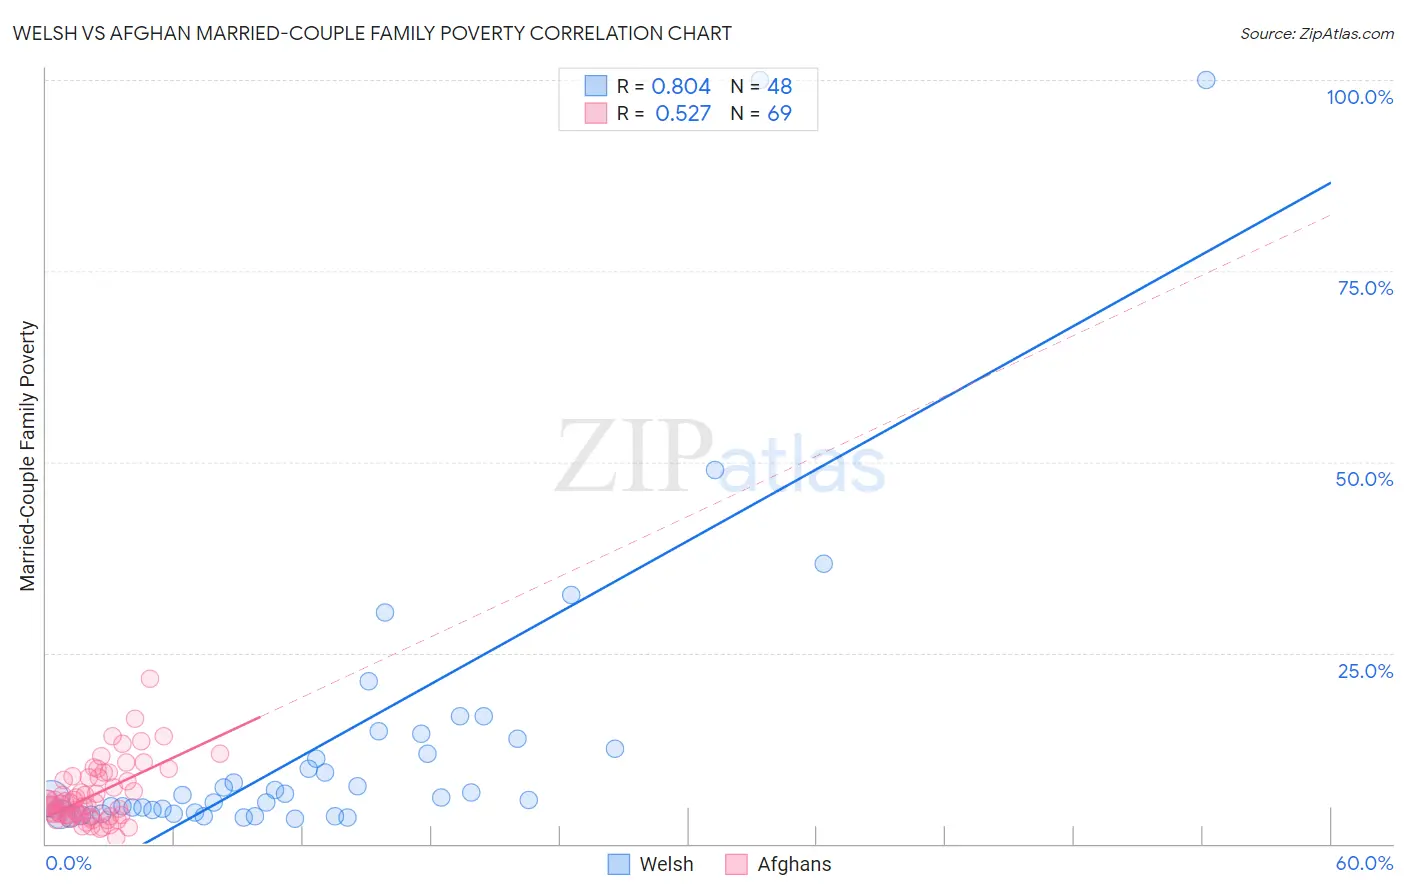
Welsh vs Afghan Married-Couple Family Poverty Correlation Chart
The statistical analysis conducted on geographies consisting of 518,114,778 people shows a very strong positive correlation between the proportion of Welsh and poverty level among married-couple families in the United States with a correlation coefficient (R) of 0.804 and weighted average of 4.3%. Similarly, the statistical analysis conducted on geographies consisting of 148,344,373 people shows a substantial positive correlation between the proportion of Afghans and poverty level among married-couple families in the United States with a correlation coefficient (R) of 0.527 and weighted average of 5.5%, a difference of 27.9%.
Married-Couple Family Poverty Correlation Summary
| Measurement | Welsh | Afghan |
| Minimum | 3.3% | 0.76% |
| Maximum | 100.0% | 21.6% |
| Range | 96.7% | 20.8% |
| Mean | 13.6% | 6.4% |
| Median | 6.3% | 5.2% |
| Interquartile 25% (IQ1) | 4.1% | 3.7% |
| Interquartile 75% (IQ3) | 13.2% | 8.7% |
| Interquartile Range (IQR) | 9.1% | 5.1% |
| Standard Deviation (Sample) | 20.5% | 3.9% |
| Standard Deviation (Population) | 20.3% | 3.9% |
Similar Demographics by Married-Couple Family Poverty
Demographics Similar to Welsh by Married-Couple Family Poverty
In terms of married-couple family poverty, the demographic groups most similar to Welsh are Russian (4.3%, a difference of 0.15%), Immigrants from Lithuania (4.3%, a difference of 0.18%), Burmese (4.3%, a difference of 0.19%), Austrian (4.3%, a difference of 0.26%), and Turkish (4.3%, a difference of 0.29%).
| Demographics | Rating | Rank | Married-Couple Family Poverty |
| British | 99.8 /100 | #46 | Exceptional 4.3% |
| Immigrants | South Central Asia | 99.8 /100 | #47 | Exceptional 4.3% |
| Australians | 99.7 /100 | #48 | Exceptional 4.3% |
| Turks | 99.7 /100 | #49 | Exceptional 4.3% |
| Burmese | 99.7 /100 | #50 | Exceptional 4.3% |
| Immigrants | Lithuania | 99.7 /100 | #51 | Exceptional 4.3% |
| Russians | 99.7 /100 | #52 | Exceptional 4.3% |
| Welsh | 99.7 /100 | #53 | Exceptional 4.3% |
| Austrians | 99.7 /100 | #54 | Exceptional 4.3% |
| French | 99.7 /100 | #55 | Exceptional 4.3% |
| Immigrants | Zimbabwe | 99.7 /100 | #56 | Exceptional 4.3% |
| Immigrants | Netherlands | 99.7 /100 | #57 | Exceptional 4.3% |
| Czechoslovakians | 99.7 /100 | #58 | Exceptional 4.4% |
| Immigrants | Sweden | 99.6 /100 | #59 | Exceptional 4.4% |
| Tlingit-Haida | 99.6 /100 | #60 | Exceptional 4.4% |
Demographics Similar to Afghans by Married-Couple Family Poverty
In terms of married-couple family poverty, the demographic groups most similar to Afghans are Immigrants from Nigeria (5.5%, a difference of 0.020%), Potawatomi (5.5%, a difference of 0.31%), Japanese (5.6%, a difference of 0.40%), Armenian (5.5%, a difference of 0.43%), and Iroquois (5.5%, a difference of 0.49%).
| Demographics | Rating | Rank | Married-Couple Family Poverty |
| Nigerians | 14.3 /100 | #211 | Poor 5.5% |
| Immigrants | Thailand | 14.0 /100 | #212 | Poor 5.5% |
| Immigrants | Liberia | 13.3 /100 | #213 | Poor 5.5% |
| Iroquois | 13.1 /100 | #214 | Poor 5.5% |
| Armenians | 12.8 /100 | #215 | Poor 5.5% |
| Potawatomi | 12.4 /100 | #216 | Poor 5.5% |
| Immigrants | Nigeria | 11.3 /100 | #217 | Poor 5.5% |
| Afghans | 11.2 /100 | #218 | Poor 5.5% |
| Japanese | 9.8 /100 | #219 | Tragic 5.6% |
| Colombians | 9.2 /100 | #220 | Tragic 5.6% |
| Panamanians | 9.2 /100 | #221 | Tragic 5.6% |
| Cajuns | 6.9 /100 | #222 | Tragic 5.6% |
| Immigrants | Fiji | 6.7 /100 | #223 | Tragic 5.6% |
| Sudanese | 6.4 /100 | #224 | Tragic 5.6% |
| Immigrants | Cambodia | 6.1 /100 | #225 | Tragic 5.6% |