Austrian vs Kiowa Single Female Poverty
COMPARE
Austrian
Kiowa
Single Female Poverty
Single Female Poverty Comparison
Austrians
Kiowa
20.4%
SINGLE FEMALE POVERTY
85.8/ 100
METRIC RATING
145th/ 347
METRIC RANK
26.9%
SINGLE FEMALE POVERTY
0.0/ 100
METRIC RATING
324th/ 347
METRIC RANK
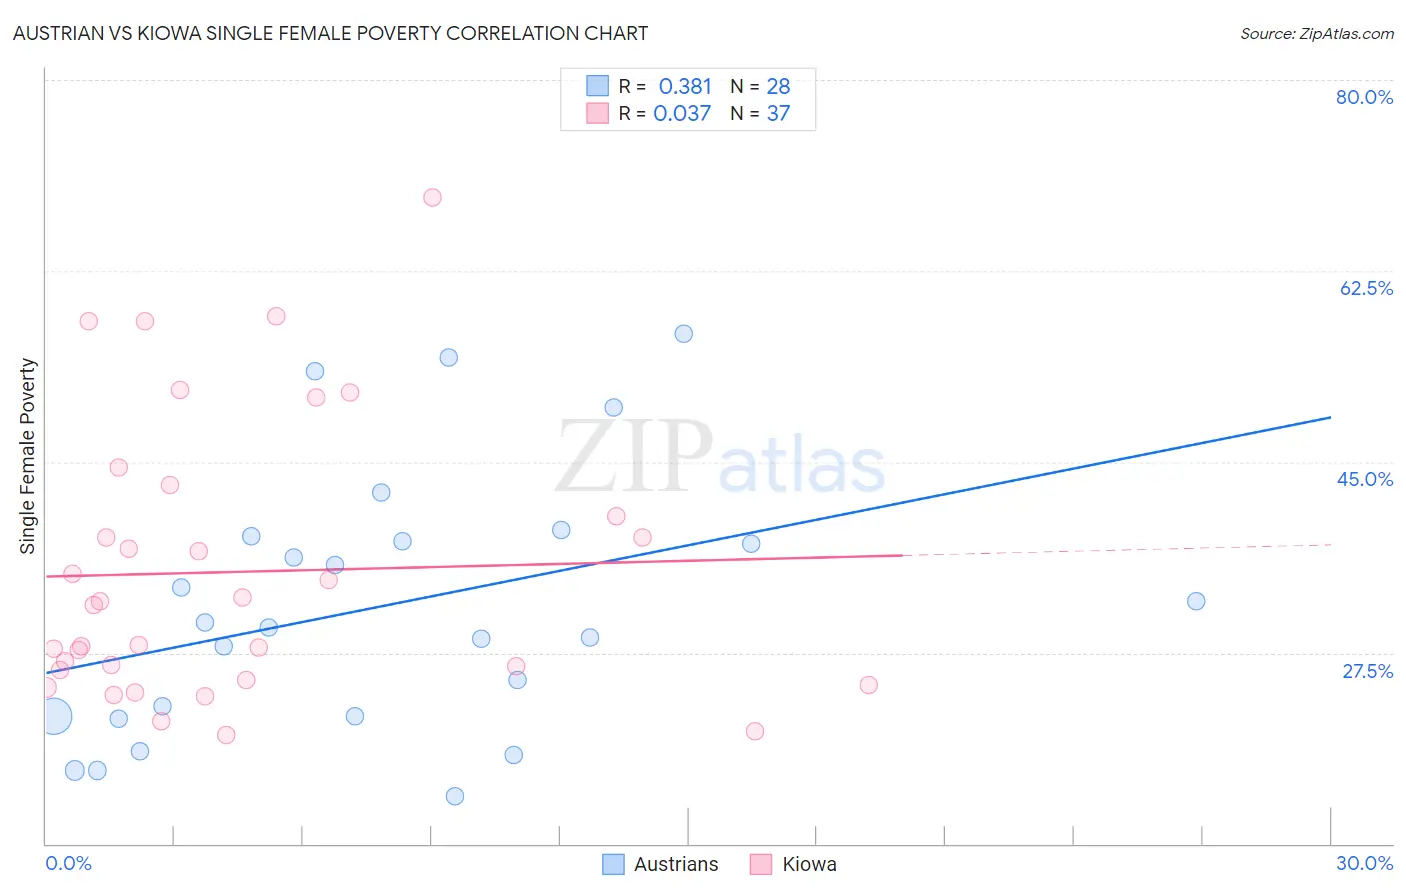
Austrian vs Kiowa Single Female Poverty Correlation Chart
The statistical analysis conducted on geographies consisting of 441,015,533 people shows a mild positive correlation between the proportion of Austrians and poverty level among single females in the United States with a correlation coefficient (R) of 0.381 and weighted average of 20.4%. Similarly, the statistical analysis conducted on geographies consisting of 55,984,677 people shows no correlation between the proportion of Kiowa and poverty level among single females in the United States with a correlation coefficient (R) of 0.037 and weighted average of 26.9%, a difference of 31.9%.
Single Female Poverty Correlation Summary
| Measurement | Austrian | Kiowa |
| Minimum | 14.3% | 20.0% |
| Maximum | 56.8% | 69.2% |
| Range | 42.4% | 49.2% |
| Mean | 31.8% | 34.9% |
| Median | 30.1% | 31.9% |
| Interquartile 25% (IQ1) | 21.7% | 25.4% |
| Interquartile 75% (IQ3) | 37.9% | 41.4% |
| Interquartile Range (IQR) | 16.2% | 16.0% |
| Standard Deviation (Sample) | 11.9% | 12.6% |
| Standard Deviation (Population) | 11.7% | 12.4% |
Similar Demographics by Single Female Poverty
Demographics Similar to Austrians by Single Female Poverty
In terms of single female poverty, the demographic groups most similar to Austrians are Venezuelan (20.4%, a difference of 0.030%), South African (20.4%, a difference of 0.060%), Luxembourger (20.4%, a difference of 0.11%), Immigrants from Uzbekistan (20.3%, a difference of 0.36%), and Australian (20.3%, a difference of 0.37%).
| Demographics | Rating | Rank | Single Female Poverty |
| Slovenes | 90.5 /100 | #138 | Exceptional 20.3% |
| Immigrants | Kuwait | 90.4 /100 | #139 | Exceptional 20.3% |
| Syrians | 90.4 /100 | #140 | Exceptional 20.3% |
| Immigrants | North America | 89.5 /100 | #141 | Excellent 20.3% |
| Immigrants | Uganda | 89.1 /100 | #142 | Excellent 20.3% |
| Australians | 88.4 /100 | #143 | Excellent 20.3% |
| Immigrants | Uzbekistan | 88.3 /100 | #144 | Excellent 20.3% |
| Austrians | 85.8 /100 | #145 | Excellent 20.4% |
| Venezuelans | 85.5 /100 | #146 | Excellent 20.4% |
| South Africans | 85.3 /100 | #147 | Excellent 20.4% |
| Luxembourgers | 84.9 /100 | #148 | Excellent 20.4% |
| Portuguese | 81.5 /100 | #149 | Excellent 20.5% |
| Immigrants | Denmark | 80.5 /100 | #150 | Excellent 20.5% |
| Puget Sound Salish | 79.6 /100 | #151 | Good 20.6% |
| Immigrants | Uruguay | 77.7 /100 | #152 | Good 20.6% |
Demographics Similar to Kiowa by Single Female Poverty
In terms of single female poverty, the demographic groups most similar to Kiowa are Chippewa (26.8%, a difference of 0.41%), Seminole (26.8%, a difference of 0.52%), Choctaw (27.2%, a difference of 0.98%), Yup'ik (26.6%, a difference of 1.3%), and Creek (27.4%, a difference of 1.9%).
| Demographics | Rating | Rank | Single Female Poverty |
| Ottawa | 0.0 /100 | #317 | Tragic 26.0% |
| Chickasaw | 0.0 /100 | #318 | Tragic 26.3% |
| Blacks/African Americans | 0.0 /100 | #319 | Tragic 26.4% |
| Arapaho | 0.0 /100 | #320 | Tragic 26.4% |
| Yup'ik | 0.0 /100 | #321 | Tragic 26.6% |
| Seminole | 0.0 /100 | #322 | Tragic 26.8% |
| Chippewa | 0.0 /100 | #323 | Tragic 26.8% |
| Kiowa | 0.0 /100 | #324 | Tragic 26.9% |
| Choctaw | 0.0 /100 | #325 | Tragic 27.2% |
| Creek | 0.0 /100 | #326 | Tragic 27.4% |
| Dutch West Indians | 0.0 /100 | #327 | Tragic 27.5% |
| Apache | 0.0 /100 | #328 | Tragic 27.7% |
| Menominee | 0.0 /100 | #329 | Tragic 27.8% |
| Hopi | 0.0 /100 | #330 | Tragic 28.0% |
| Natives/Alaskans | 0.0 /100 | #331 | Tragic 28.2% |