Armenian vs Kiowa Single Female Poverty
COMPARE
Armenian
Kiowa
Single Female Poverty
Single Female Poverty Comparison
Armenians
Kiowa
18.3%
SINGLE FEMALE POVERTY
100.0/ 100
METRIC RATING
24th/ 347
METRIC RANK
26.9%
SINGLE FEMALE POVERTY
0.0/ 100
METRIC RATING
324th/ 347
METRIC RANK
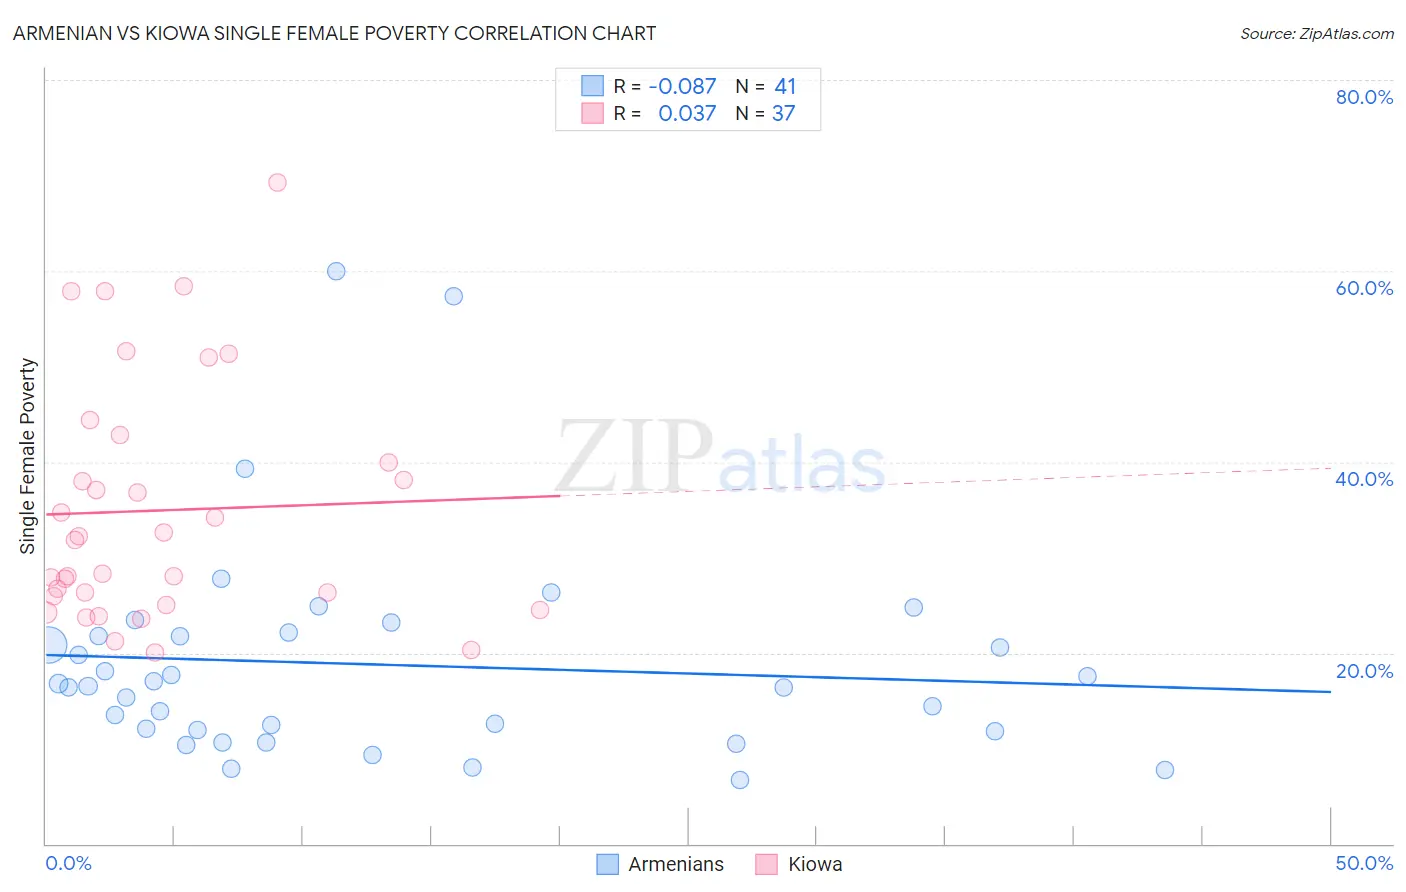
Armenian vs Kiowa Single Female Poverty Correlation Chart
The statistical analysis conducted on geographies consisting of 305,765,462 people shows a slight negative correlation between the proportion of Armenians and poverty level among single females in the United States with a correlation coefficient (R) of -0.087 and weighted average of 18.3%. Similarly, the statistical analysis conducted on geographies consisting of 55,984,677 people shows no correlation between the proportion of Kiowa and poverty level among single females in the United States with a correlation coefficient (R) of 0.037 and weighted average of 26.9%, a difference of 47.0%.
Single Female Poverty Correlation Summary
| Measurement | Armenian | Kiowa |
| Minimum | 6.7% | 20.0% |
| Maximum | 60.0% | 69.2% |
| Range | 53.3% | 49.2% |
| Mean | 18.8% | 34.9% |
| Median | 16.5% | 31.9% |
| Interquartile 25% (IQ1) | 11.9% | 25.4% |
| Interquartile 75% (IQ3) | 21.9% | 41.4% |
| Interquartile Range (IQR) | 10.1% | 16.0% |
| Standard Deviation (Sample) | 11.3% | 12.6% |
| Standard Deviation (Population) | 11.1% | 12.4% |
Similar Demographics by Single Female Poverty
Demographics Similar to Armenians by Single Female Poverty
In terms of single female poverty, the demographic groups most similar to Armenians are Immigrants from Singapore (18.3%, a difference of 0.10%), Immigrants from Israel (18.3%, a difference of 0.12%), Burmese (18.3%, a difference of 0.23%), Asian (18.3%, a difference of 0.23%), and Maltese (18.3%, a difference of 0.24%).
| Demographics | Rating | Rank | Single Female Poverty |
| Immigrants | Korea | 100.0 /100 | #17 | Exceptional 18.1% |
| Immigrants | Eastern Asia | 100.0 /100 | #18 | Exceptional 18.1% |
| Immigrants | China | 100.0 /100 | #19 | Exceptional 18.1% |
| Immigrants | Greece | 100.0 /100 | #20 | Exceptional 18.3% |
| Maltese | 100.0 /100 | #21 | Exceptional 18.3% |
| Burmese | 100.0 /100 | #22 | Exceptional 18.3% |
| Asians | 100.0 /100 | #23 | Exceptional 18.3% |
| Armenians | 100.0 /100 | #24 | Exceptional 18.3% |
| Immigrants | Singapore | 100.0 /100 | #25 | Exceptional 18.3% |
| Immigrants | Israel | 100.0 /100 | #26 | Exceptional 18.3% |
| Immigrants | Pakistan | 100.0 /100 | #27 | Exceptional 18.4% |
| Immigrants | Moldova | 100.0 /100 | #28 | Exceptional 18.5% |
| Immigrants | Poland | 100.0 /100 | #29 | Exceptional 18.5% |
| Immigrants | North Macedonia | 99.9 /100 | #30 | Exceptional 18.5% |
| Immigrants | Asia | 99.9 /100 | #31 | Exceptional 18.6% |
Demographics Similar to Kiowa by Single Female Poverty
In terms of single female poverty, the demographic groups most similar to Kiowa are Chippewa (26.8%, a difference of 0.41%), Seminole (26.8%, a difference of 0.52%), Choctaw (27.2%, a difference of 0.98%), Yup'ik (26.6%, a difference of 1.3%), and Creek (27.4%, a difference of 1.9%).
| Demographics | Rating | Rank | Single Female Poverty |
| Ottawa | 0.0 /100 | #317 | Tragic 26.0% |
| Chickasaw | 0.0 /100 | #318 | Tragic 26.3% |
| Blacks/African Americans | 0.0 /100 | #319 | Tragic 26.4% |
| Arapaho | 0.0 /100 | #320 | Tragic 26.4% |
| Yup'ik | 0.0 /100 | #321 | Tragic 26.6% |
| Seminole | 0.0 /100 | #322 | Tragic 26.8% |
| Chippewa | 0.0 /100 | #323 | Tragic 26.8% |
| Kiowa | 0.0 /100 | #324 | Tragic 26.9% |
| Choctaw | 0.0 /100 | #325 | Tragic 27.2% |
| Creek | 0.0 /100 | #326 | Tragic 27.4% |
| Dutch West Indians | 0.0 /100 | #327 | Tragic 27.5% |
| Apache | 0.0 /100 | #328 | Tragic 27.7% |
| Menominee | 0.0 /100 | #329 | Tragic 27.8% |
| Hopi | 0.0 /100 | #330 | Tragic 28.0% |
| Natives/Alaskans | 0.0 /100 | #331 | Tragic 28.2% |