Somali vs Trinidadian and Tobagonian Married-Couple Family Poverty
COMPARE
Somali
Trinidadian and Tobagonian
Married-Couple Family Poverty
Married-Couple Family Poverty Comparison
Somalis
Trinidadians and Tobagonians
5.8%
MARRIED-COUPLE FAMILY POVERTY
2.3/ 100
METRIC RATING
243rd/ 347
METRIC RANK
6.2%
MARRIED-COUPLE FAMILY POVERTY
0.1/ 100
METRIC RATING
272nd/ 347
METRIC RANK
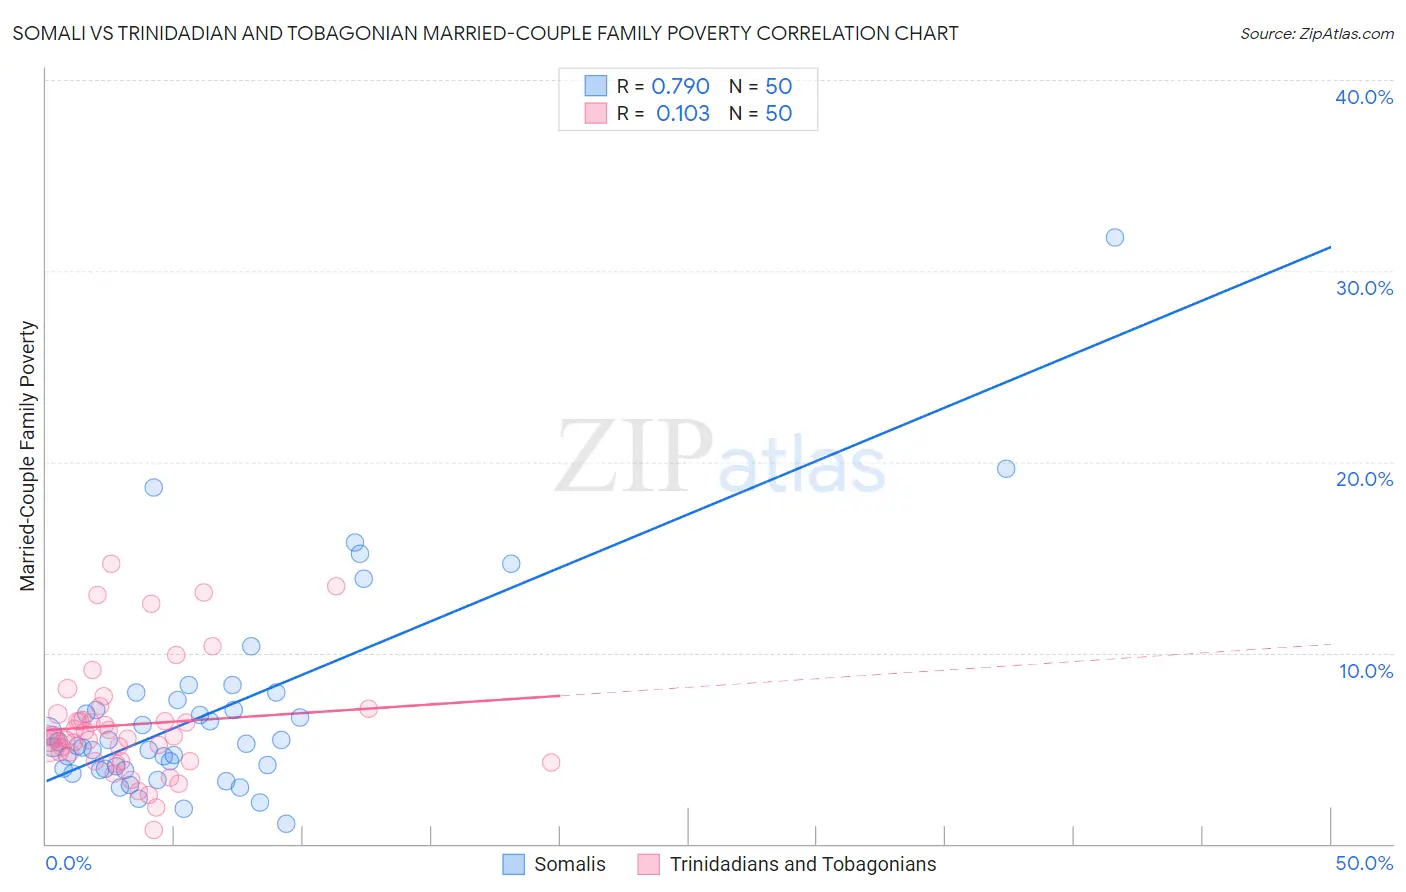
Somali vs Trinidadian and Tobagonian Married-Couple Family Poverty Correlation Chart
The statistical analysis conducted on geographies consisting of 99,100,573 people shows a strong positive correlation between the proportion of Somalis and poverty level among married-couple families in the United States with a correlation coefficient (R) of 0.790 and weighted average of 5.8%. Similarly, the statistical analysis conducted on geographies consisting of 218,634,387 people shows a poor positive correlation between the proportion of Trinidadians and Tobagonians and poverty level among married-couple families in the United States with a correlation coefficient (R) of 0.103 and weighted average of 6.2%, a difference of 7.6%.
Married-Couple Family Poverty Correlation Summary
| Measurement | Somali | Trinidadian and Tobagonian |
| Minimum | 1.1% | 0.75% |
| Maximum | 31.7% | 14.6% |
| Range | 30.7% | 13.9% |
| Mean | 7.0% | 6.3% |
| Median | 5.2% | 5.6% |
| Interquartile 25% (IQ1) | 3.9% | 4.3% |
| Interquartile 75% (IQ3) | 7.5% | 6.8% |
| Interquartile Range (IQR) | 3.6% | 2.4% |
| Standard Deviation (Sample) | 5.5% | 3.0% |
| Standard Deviation (Population) | 5.4% | 3.0% |
Similar Demographics by Married-Couple Family Poverty
Demographics Similar to Somalis by Married-Couple Family Poverty
In terms of married-couple family poverty, the demographic groups most similar to Somalis are Chickasaw (5.8%, a difference of 0.010%), Immigrants from Western Africa (5.8%, a difference of 0.16%), Immigrants from Afghanistan (5.8%, a difference of 0.16%), Immigrants from Panama (5.8%, a difference of 0.24%), and Fijian (5.8%, a difference of 0.27%).
| Demographics | Rating | Rank | Married-Couple Family Poverty |
| Ghanaians | 3.3 /100 | #236 | Tragic 5.7% |
| Immigrants | South America | 3.1 /100 | #237 | Tragic 5.7% |
| Cherokee | 2.7 /100 | #238 | Tragic 5.8% |
| Venezuelans | 2.7 /100 | #239 | Tragic 5.8% |
| Fijians | 2.5 /100 | #240 | Tragic 5.8% |
| Immigrants | Panama | 2.5 /100 | #241 | Tragic 5.8% |
| Immigrants | Western Africa | 2.4 /100 | #242 | Tragic 5.8% |
| Somalis | 2.3 /100 | #243 | Tragic 5.8% |
| Chickasaw | 2.3 /100 | #244 | Tragic 5.8% |
| Immigrants | Afghanistan | 2.1 /100 | #245 | Tragic 5.8% |
| Immigrants | Venezuela | 1.8 /100 | #246 | Tragic 5.8% |
| Iraqis | 1.4 /100 | #247 | Tragic 5.9% |
| Cree | 1.2 /100 | #248 | Tragic 5.9% |
| Tsimshian | 1.1 /100 | #249 | Tragic 5.9% |
| Immigrants | Eritrea | 1.1 /100 | #250 | Tragic 5.9% |
Demographics Similar to Trinidadians and Tobagonians by Married-Couple Family Poverty
In terms of married-couple family poverty, the demographic groups most similar to Trinidadians and Tobagonians are Immigrants from Bahamas (6.2%, a difference of 0.030%), Immigrants from Jamaica (6.2%, a difference of 0.25%), Immigrants from West Indies (6.2%, a difference of 0.29%), Alaska Native (6.2%, a difference of 0.46%), and Colville (6.3%, a difference of 0.78%).
| Demographics | Rating | Rank | Married-Couple Family Poverty |
| Blackfeet | 0.2 /100 | #265 | Tragic 6.2% |
| Creek | 0.2 /100 | #266 | Tragic 6.2% |
| Spanish Americans | 0.2 /100 | #267 | Tragic 6.2% |
| Alaska Natives | 0.2 /100 | #268 | Tragic 6.2% |
| Immigrants | West Indies | 0.1 /100 | #269 | Tragic 6.2% |
| Immigrants | Jamaica | 0.1 /100 | #270 | Tragic 6.2% |
| Immigrants | Bahamas | 0.1 /100 | #271 | Tragic 6.2% |
| Trinidadians and Tobagonians | 0.1 /100 | #272 | Tragic 6.2% |
| Colville | 0.1 /100 | #273 | Tragic 6.3% |
| Barbadians | 0.1 /100 | #274 | Tragic 6.3% |
| Choctaw | 0.1 /100 | #275 | Tragic 6.3% |
| Yaqui | 0.1 /100 | #276 | Tragic 6.3% |
| Indonesians | 0.1 /100 | #277 | Tragic 6.3% |
| Immigrants | Trinidad and Tobago | 0.1 /100 | #278 | Tragic 6.4% |
| Houma | 0.0 /100 | #279 | Tragic 6.4% |