Somali vs Trinidadian and Tobagonian Receiving Food Stamps
COMPARE
Somali
Trinidadian and Tobagonian
Receiving Food Stamps
Receiving Food Stamps Comparison
Somalis
Trinidadians and Tobagonians
13.7%
RECEIVING FOOD STAMPS
0.9/ 100
METRIC RATING
243rd/ 347
METRIC RANK
16.0%
RECEIVING FOOD STAMPS
0.0/ 100
METRIC RATING
301st/ 347
METRIC RANK
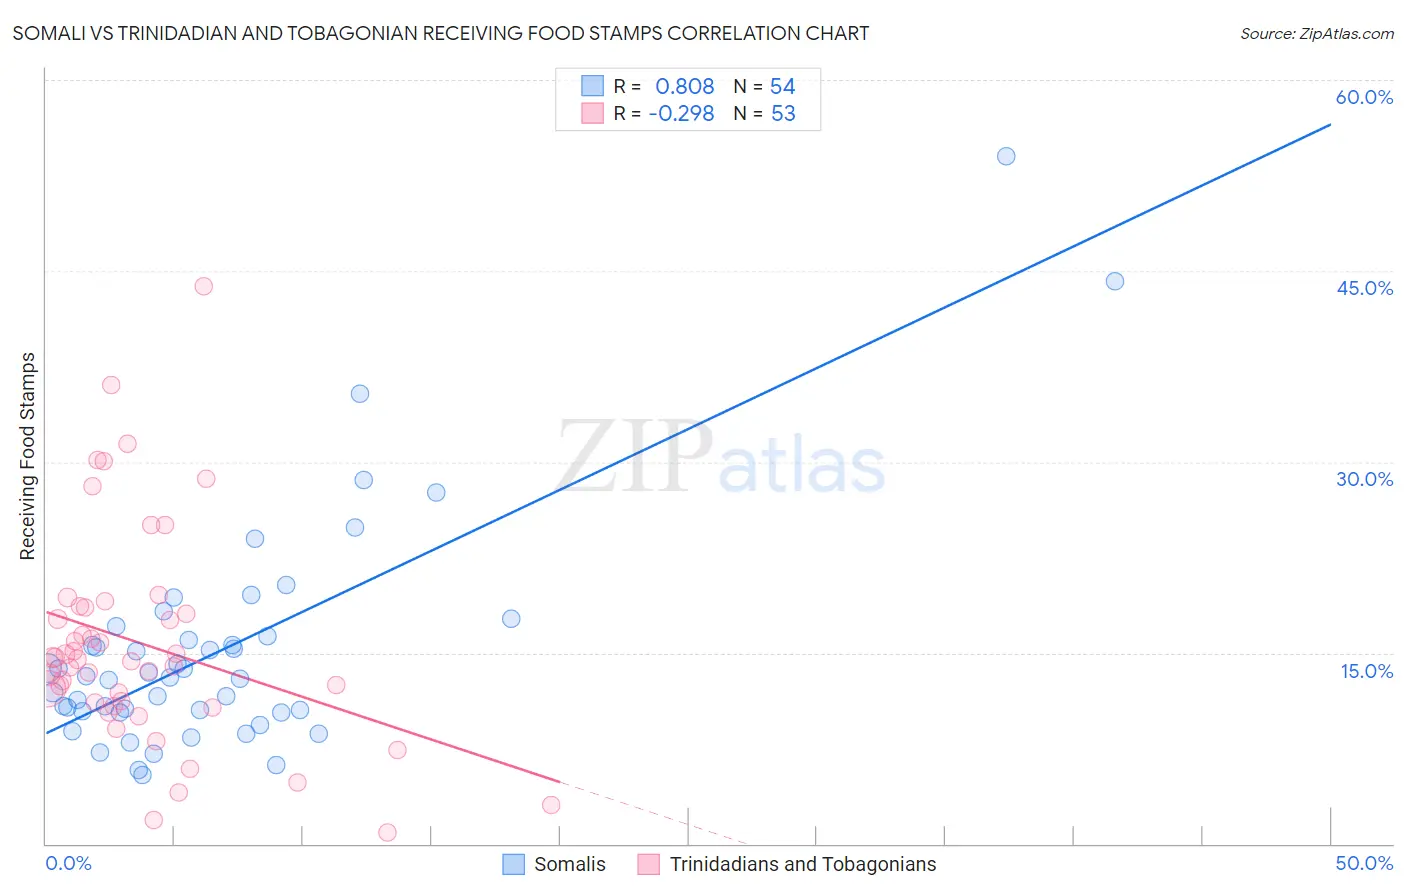
Somali vs Trinidadian and Tobagonian Receiving Food Stamps Correlation Chart
The statistical analysis conducted on geographies consisting of 99,256,962 people shows a very strong positive correlation between the proportion of Somalis and percentage of population receiving government assistance and/or food stamps in the United States with a correlation coefficient (R) of 0.808 and weighted average of 13.7%. Similarly, the statistical analysis conducted on geographies consisting of 219,495,740 people shows a weak negative correlation between the proportion of Trinidadians and Tobagonians and percentage of population receiving government assistance and/or food stamps in the United States with a correlation coefficient (R) of -0.298 and weighted average of 16.0%, a difference of 17.0%.
Receiving Food Stamps Correlation Summary
| Measurement | Somali | Trinidadian and Tobagonian |
| Minimum | 5.4% | 0.90% |
| Maximum | 54.0% | 43.8% |
| Range | 48.6% | 42.9% |
| Mean | 15.2% | 15.7% |
| Median | 13.1% | 14.5% |
| Interquartile 25% (IQ1) | 10.4% | 10.9% |
| Interquartile 75% (IQ3) | 16.3% | 18.6% |
| Interquartile Range (IQR) | 5.9% | 7.7% |
| Standard Deviation (Sample) | 9.0% | 8.5% |
| Standard Deviation (Population) | 8.9% | 8.4% |
Similar Demographics by Receiving Food Stamps
Demographics Similar to Somalis by Receiving Food Stamps
In terms of receiving food stamps, the demographic groups most similar to Somalis are Cajun (13.7%, a difference of 0.16%), Immigrants from Panama (13.6%, a difference of 0.19%), Immigrants from Somalia (13.7%, a difference of 0.20%), Choctaw (13.6%, a difference of 0.38%), and Cree (13.7%, a difference of 0.44%).
| Demographics | Rating | Rank | Receiving Food Stamps |
| Crow | 1.6 /100 | #236 | Tragic 13.4% |
| Immigrants | El Salvador | 1.5 /100 | #237 | Tragic 13.5% |
| French American Indians | 1.4 /100 | #238 | Tragic 13.5% |
| Immigrants | Micronesia | 1.3 /100 | #239 | Tragic 13.5% |
| Iroquois | 1.2 /100 | #240 | Tragic 13.5% |
| Choctaw | 1.0 /100 | #241 | Tragic 13.6% |
| Immigrants | Panama | 1.0 /100 | #242 | Tragic 13.6% |
| Somalis | 0.9 /100 | #243 | Tragic 13.7% |
| Cajuns | 0.9 /100 | #244 | Tragic 13.7% |
| Immigrants | Somalia | 0.9 /100 | #245 | Tragic 13.7% |
| Cree | 0.8 /100 | #246 | Tragic 13.7% |
| Mexican American Indians | 0.7 /100 | #247 | Tragic 13.8% |
| Immigrants | Laos | 0.7 /100 | #248 | Tragic 13.8% |
| Indonesians | 0.6 /100 | #249 | Tragic 13.9% |
| Immigrants | Cambodia | 0.5 /100 | #250 | Tragic 13.9% |
Demographics Similar to Trinidadians and Tobagonians by Receiving Food Stamps
In terms of receiving food stamps, the demographic groups most similar to Trinidadians and Tobagonians are Immigrants from Bangladesh (15.9%, a difference of 0.45%), Hispanic or Latino (15.8%, a difference of 0.89%), Immigrants from West Indies (16.1%, a difference of 0.94%), Nicaraguan (16.1%, a difference of 1.0%), and Immigrants from Trinidad and Tobago (15.8%, a difference of 1.2%).
| Demographics | Rating | Rank | Receiving Food Stamps |
| Immigrants | Latin America | 0.0 /100 | #294 | Tragic 15.7% |
| Immigrants | Honduras | 0.0 /100 | #295 | Tragic 15.7% |
| Tsimshian | 0.0 /100 | #296 | Tragic 15.7% |
| Immigrants | Bahamas | 0.0 /100 | #297 | Tragic 15.8% |
| Immigrants | Trinidad and Tobago | 0.0 /100 | #298 | Tragic 15.8% |
| Hispanics or Latinos | 0.0 /100 | #299 | Tragic 15.8% |
| Immigrants | Bangladesh | 0.0 /100 | #300 | Tragic 15.9% |
| Trinidadians and Tobagonians | 0.0 /100 | #301 | Tragic 16.0% |
| Immigrants | West Indies | 0.0 /100 | #302 | Tragic 16.1% |
| Nicaraguans | 0.0 /100 | #303 | Tragic 16.1% |
| West Indians | 0.0 /100 | #304 | Tragic 16.3% |
| Immigrants | Azores | 0.0 /100 | #305 | Tragic 16.4% |
| Jamaicans | 0.0 /100 | #306 | Tragic 16.4% |
| Houma | 0.0 /100 | #307 | Tragic 16.5% |
| Barbadians | 0.0 /100 | #308 | Tragic 16.5% |