Somali vs Immigrants from Japan Married-Couple Family Poverty
COMPARE
Somali
Immigrants from Japan
Married-Couple Family Poverty
Married-Couple Family Poverty Comparison
Somalis
Immigrants from Japan
5.8%
MARRIED-COUPLE FAMILY POVERTY
2.3/ 100
METRIC RATING
243rd/ 347
METRIC RANK
4.3%
MARRIED-COUPLE FAMILY POVERTY
99.8/ 100
METRIC RATING
44th/ 347
METRIC RANK
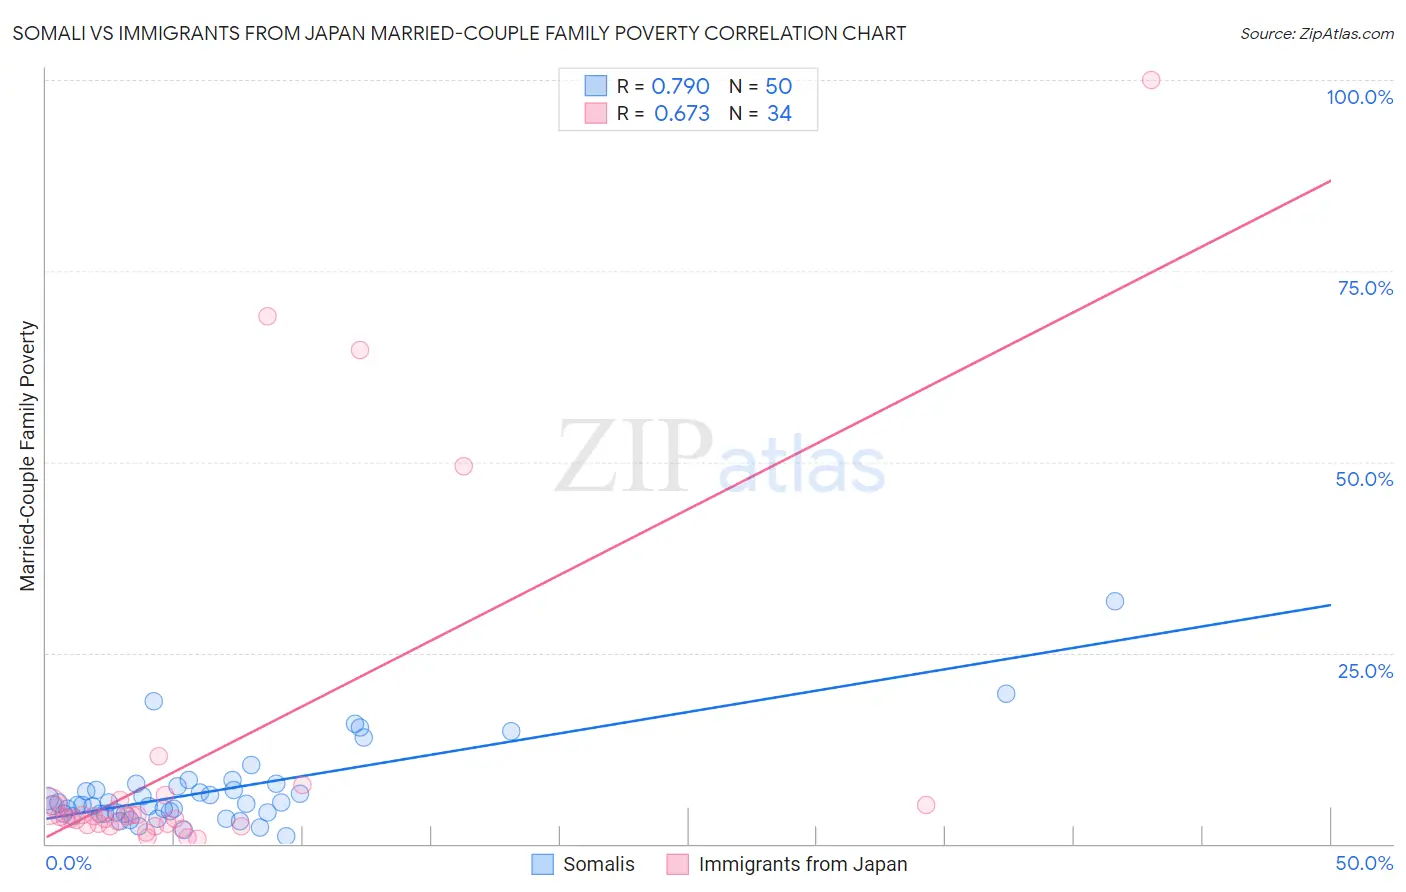
Somali vs Immigrants from Japan Married-Couple Family Poverty Correlation Chart
The statistical analysis conducted on geographies consisting of 99,100,573 people shows a strong positive correlation between the proportion of Somalis and poverty level among married-couple families in the United States with a correlation coefficient (R) of 0.790 and weighted average of 5.8%. Similarly, the statistical analysis conducted on geographies consisting of 337,873,757 people shows a significant positive correlation between the proportion of Immigrants from Japan and poverty level among married-couple families in the United States with a correlation coefficient (R) of 0.673 and weighted average of 4.3%, a difference of 34.6%.
Married-Couple Family Poverty Correlation Summary
| Measurement | Somali | Immigrants from Japan |
| Minimum | 1.1% | 0.67% |
| Maximum | 31.7% | 100.0% |
| Range | 30.7% | 99.3% |
| Mean | 7.0% | 11.5% |
| Median | 5.2% | 3.5% |
| Interquartile 25% (IQ1) | 3.9% | 2.5% |
| Interquartile 75% (IQ3) | 7.5% | 5.0% |
| Interquartile Range (IQR) | 3.6% | 2.5% |
| Standard Deviation (Sample) | 5.5% | 23.0% |
| Standard Deviation (Population) | 5.4% | 22.6% |
Similar Demographics by Married-Couple Family Poverty
Demographics Similar to Somalis by Married-Couple Family Poverty
In terms of married-couple family poverty, the demographic groups most similar to Somalis are Chickasaw (5.8%, a difference of 0.010%), Immigrants from Western Africa (5.8%, a difference of 0.16%), Immigrants from Afghanistan (5.8%, a difference of 0.16%), Immigrants from Panama (5.8%, a difference of 0.24%), and Fijian (5.8%, a difference of 0.27%).
| Demographics | Rating | Rank | Married-Couple Family Poverty |
| Ghanaians | 3.3 /100 | #236 | Tragic 5.7% |
| Immigrants | South America | 3.1 /100 | #237 | Tragic 5.7% |
| Cherokee | 2.7 /100 | #238 | Tragic 5.8% |
| Venezuelans | 2.7 /100 | #239 | Tragic 5.8% |
| Fijians | 2.5 /100 | #240 | Tragic 5.8% |
| Immigrants | Panama | 2.5 /100 | #241 | Tragic 5.8% |
| Immigrants | Western Africa | 2.4 /100 | #242 | Tragic 5.8% |
| Somalis | 2.3 /100 | #243 | Tragic 5.8% |
| Chickasaw | 2.3 /100 | #244 | Tragic 5.8% |
| Immigrants | Afghanistan | 2.1 /100 | #245 | Tragic 5.8% |
| Immigrants | Venezuela | 1.8 /100 | #246 | Tragic 5.8% |
| Iraqis | 1.4 /100 | #247 | Tragic 5.9% |
| Cree | 1.2 /100 | #248 | Tragic 5.9% |
| Tsimshian | 1.1 /100 | #249 | Tragic 5.9% |
| Immigrants | Eritrea | 1.1 /100 | #250 | Tragic 5.9% |
Demographics Similar to Immigrants from Japan by Married-Couple Family Poverty
In terms of married-couple family poverty, the demographic groups most similar to Immigrants from Japan are Serbian (4.3%, a difference of 0.020%), British (4.3%, a difference of 0.050%), Immigrants from South Central Asia (4.3%, a difference of 0.16%), Australian (4.3%, a difference of 0.23%), and Turkish (4.3%, a difference of 0.31%).
| Demographics | Rating | Rank | Married-Couple Family Poverty |
| Iranians | 99.9 /100 | #37 | Exceptional 4.2% |
| Belgians | 99.9 /100 | #38 | Exceptional 4.2% |
| Immigrants | Northern Europe | 99.8 /100 | #39 | Exceptional 4.2% |
| French Canadians | 99.8 /100 | #40 | Exceptional 4.2% |
| Northern Europeans | 99.8 /100 | #41 | Exceptional 4.3% |
| Scottish | 99.8 /100 | #42 | Exceptional 4.3% |
| Swiss | 99.8 /100 | #43 | Exceptional 4.3% |
| Immigrants | Japan | 99.8 /100 | #44 | Exceptional 4.3% |
| Serbians | 99.8 /100 | #45 | Exceptional 4.3% |
| British | 99.8 /100 | #46 | Exceptional 4.3% |
| Immigrants | South Central Asia | 99.8 /100 | #47 | Exceptional 4.3% |
| Australians | 99.7 /100 | #48 | Exceptional 4.3% |
| Turks | 99.7 /100 | #49 | Exceptional 4.3% |
| Burmese | 99.7 /100 | #50 | Exceptional 4.3% |
| Immigrants | Lithuania | 99.7 /100 | #51 | Exceptional 4.3% |