Kenyan vs Trinidadian and Tobagonian Married-Couple Family Poverty
COMPARE
Kenyan
Trinidadian and Tobagonian
Married-Couple Family Poverty
Married-Couple Family Poverty Comparison
Kenyans
Trinidadians and Tobagonians
4.8%
MARRIED-COUPLE FAMILY POVERTY
94.7/ 100
METRIC RATING
117th/ 347
METRIC RANK
6.2%
MARRIED-COUPLE FAMILY POVERTY
0.1/ 100
METRIC RATING
272nd/ 347
METRIC RANK
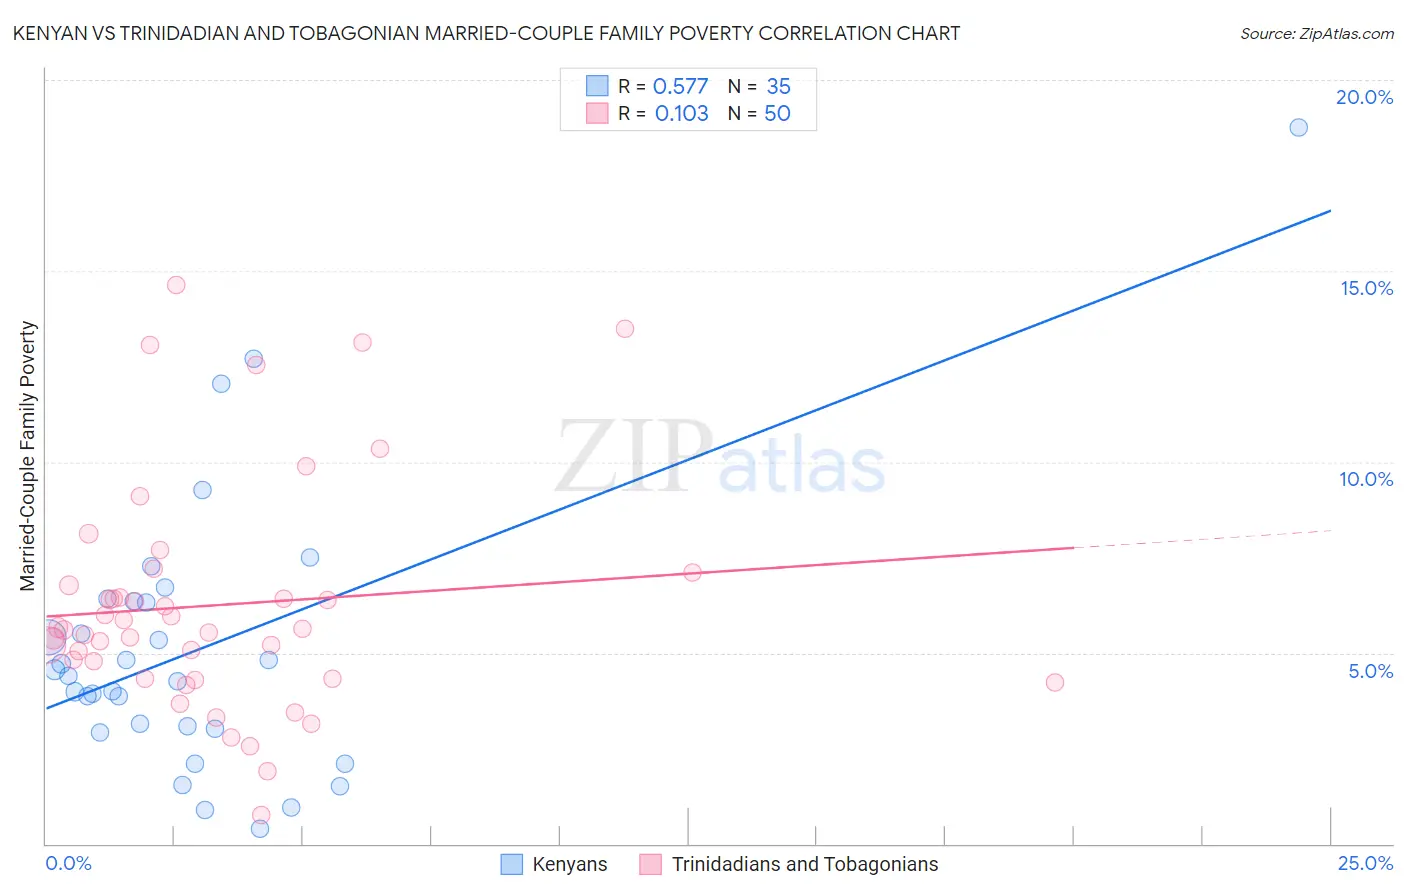
Kenyan vs Trinidadian and Tobagonian Married-Couple Family Poverty Correlation Chart
The statistical analysis conducted on geographies consisting of 167,574,201 people shows a substantial positive correlation between the proportion of Kenyans and poverty level among married-couple families in the United States with a correlation coefficient (R) of 0.577 and weighted average of 4.8%. Similarly, the statistical analysis conducted on geographies consisting of 218,634,387 people shows a poor positive correlation between the proportion of Trinidadians and Tobagonians and poverty level among married-couple families in the United States with a correlation coefficient (R) of 0.103 and weighted average of 6.2%, a difference of 30.3%.
Married-Couple Family Poverty Correlation Summary
| Measurement | Kenyan | Trinidadian and Tobagonian |
| Minimum | 0.40% | 0.75% |
| Maximum | 18.8% | 14.6% |
| Range | 18.3% | 13.9% |
| Mean | 5.1% | 6.3% |
| Median | 4.4% | 5.6% |
| Interquartile 25% (IQ1) | 3.0% | 4.3% |
| Interquartile 75% (IQ3) | 6.3% | 6.8% |
| Interquartile Range (IQR) | 3.3% | 2.4% |
| Standard Deviation (Sample) | 3.7% | 3.0% |
| Standard Deviation (Population) | 3.6% | 3.0% |
Similar Demographics by Married-Couple Family Poverty
Demographics Similar to Kenyans by Married-Couple Family Poverty
In terms of married-couple family poverty, the demographic groups most similar to Kenyans are Immigrants from Philippines (4.8%, a difference of 0.020%), Celtic (4.8%, a difference of 0.10%), Taiwanese (4.8%, a difference of 0.11%), Immigrants from Indonesia (4.8%, a difference of 0.26%), and Immigrants from Eastern Asia (4.8%, a difference of 0.39%).
| Demographics | Rating | Rank | Married-Couple Family Poverty |
| Immigrants | Bolivia | 96.2 /100 | #110 | Exceptional 4.7% |
| Pakistanis | 96.2 /100 | #111 | Exceptional 4.7% |
| Tongans | 95.9 /100 | #112 | Exceptional 4.7% |
| Immigrants | Nepal | 95.9 /100 | #113 | Exceptional 4.7% |
| Immigrants | Indonesia | 95.1 /100 | #114 | Exceptional 4.8% |
| Taiwanese | 94.8 /100 | #115 | Exceptional 4.8% |
| Celtics | 94.8 /100 | #116 | Exceptional 4.8% |
| Kenyans | 94.7 /100 | #117 | Exceptional 4.8% |
| Immigrants | Philippines | 94.6 /100 | #118 | Exceptional 4.8% |
| Immigrants | Eastern Asia | 94.0 /100 | #119 | Exceptional 4.8% |
| Immigrants | Southern Europe | 93.4 /100 | #120 | Exceptional 4.8% |
| Indians (Asian) | 93.2 /100 | #121 | Exceptional 4.8% |
| Whites/Caucasians | 93.1 /100 | #122 | Exceptional 4.8% |
| Jordanians | 93.1 /100 | #123 | Exceptional 4.8% |
| Romanians | 92.5 /100 | #124 | Exceptional 4.8% |
Demographics Similar to Trinidadians and Tobagonians by Married-Couple Family Poverty
In terms of married-couple family poverty, the demographic groups most similar to Trinidadians and Tobagonians are Immigrants from Bahamas (6.2%, a difference of 0.030%), Immigrants from Jamaica (6.2%, a difference of 0.25%), Immigrants from West Indies (6.2%, a difference of 0.29%), Alaska Native (6.2%, a difference of 0.46%), and Colville (6.3%, a difference of 0.78%).
| Demographics | Rating | Rank | Married-Couple Family Poverty |
| Blackfeet | 0.2 /100 | #265 | Tragic 6.2% |
| Creek | 0.2 /100 | #266 | Tragic 6.2% |
| Spanish Americans | 0.2 /100 | #267 | Tragic 6.2% |
| Alaska Natives | 0.2 /100 | #268 | Tragic 6.2% |
| Immigrants | West Indies | 0.1 /100 | #269 | Tragic 6.2% |
| Immigrants | Jamaica | 0.1 /100 | #270 | Tragic 6.2% |
| Immigrants | Bahamas | 0.1 /100 | #271 | Tragic 6.2% |
| Trinidadians and Tobagonians | 0.1 /100 | #272 | Tragic 6.2% |
| Colville | 0.1 /100 | #273 | Tragic 6.3% |
| Barbadians | 0.1 /100 | #274 | Tragic 6.3% |
| Choctaw | 0.1 /100 | #275 | Tragic 6.3% |
| Yaqui | 0.1 /100 | #276 | Tragic 6.3% |
| Indonesians | 0.1 /100 | #277 | Tragic 6.3% |
| Immigrants | Trinidad and Tobago | 0.1 /100 | #278 | Tragic 6.4% |
| Houma | 0.0 /100 | #279 | Tragic 6.4% |