Maltese vs Trinidadian and Tobagonian Married-Couple Family Poverty
COMPARE
Maltese
Trinidadian and Tobagonian
Married-Couple Family Poverty
Married-Couple Family Poverty Comparison
Maltese
Trinidadians and Tobagonians
4.1%
MARRIED-COUPLE FAMILY POVERTY
99.9/ 100
METRIC RATING
20th/ 347
METRIC RANK
6.2%
MARRIED-COUPLE FAMILY POVERTY
0.1/ 100
METRIC RATING
272nd/ 347
METRIC RANK
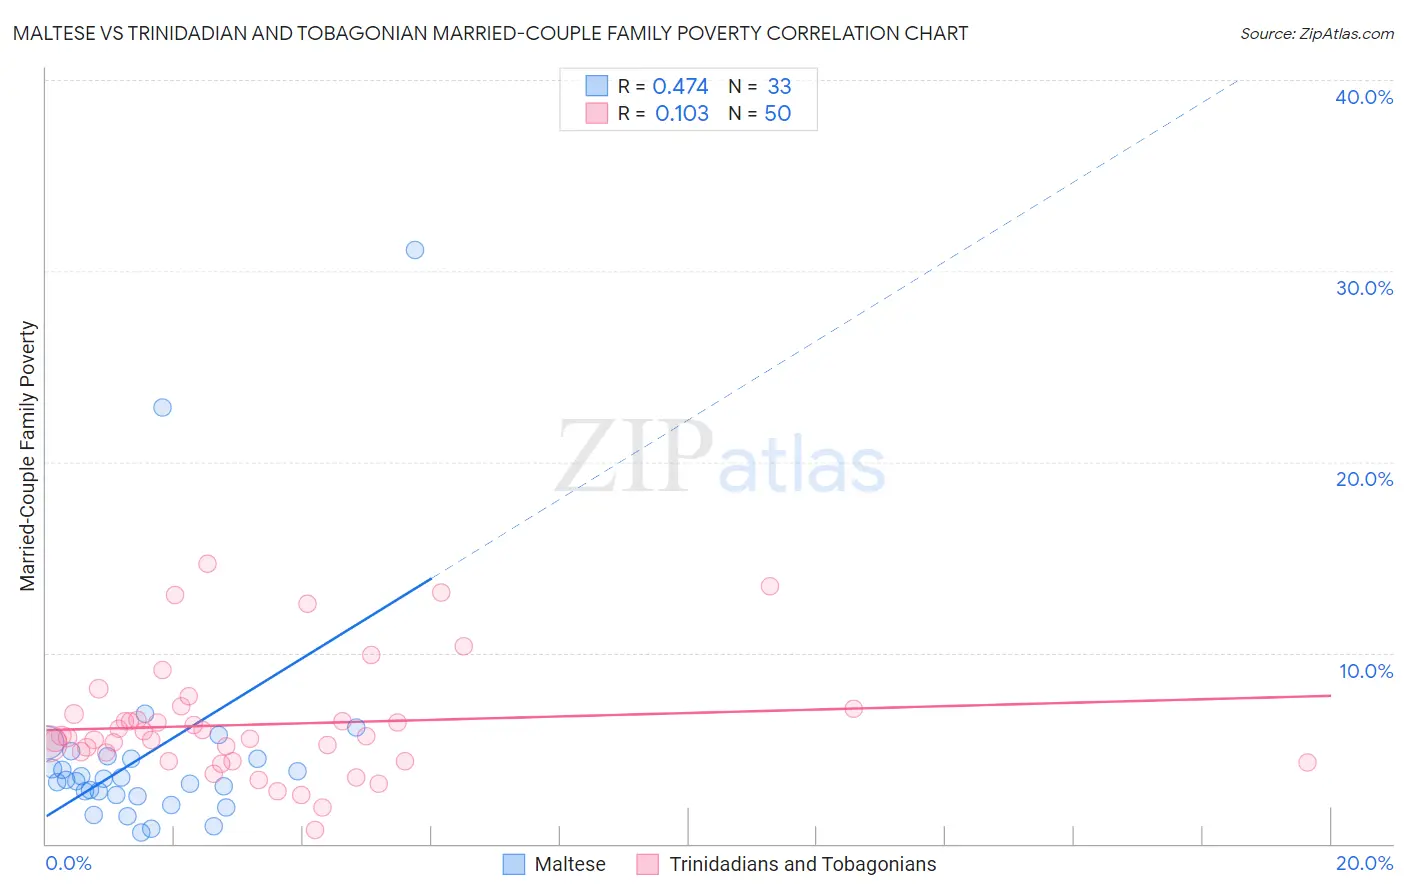
Maltese vs Trinidadian and Tobagonian Married-Couple Family Poverty Correlation Chart
The statistical analysis conducted on geographies consisting of 125,965,353 people shows a moderate positive correlation between the proportion of Maltese and poverty level among married-couple families in the United States with a correlation coefficient (R) of 0.474 and weighted average of 4.1%. Similarly, the statistical analysis conducted on geographies consisting of 218,634,387 people shows a poor positive correlation between the proportion of Trinidadians and Tobagonians and poverty level among married-couple families in the United States with a correlation coefficient (R) of 0.103 and weighted average of 6.2%, a difference of 52.8%.
Married-Couple Family Poverty Correlation Summary
| Measurement | Maltese | Trinidadian and Tobagonian |
| Minimum | 0.56% | 0.75% |
| Maximum | 31.1% | 14.6% |
| Range | 30.6% | 13.9% |
| Mean | 4.7% | 6.3% |
| Median | 3.3% | 5.6% |
| Interquartile 25% (IQ1) | 2.5% | 4.3% |
| Interquartile 75% (IQ3) | 4.5% | 6.8% |
| Interquartile Range (IQR) | 2.0% | 2.4% |
| Standard Deviation (Sample) | 6.0% | 3.0% |
| Standard Deviation (Population) | 5.9% | 3.0% |
Similar Demographics by Married-Couple Family Poverty
Demographics Similar to Maltese by Married-Couple Family Poverty
In terms of married-couple family poverty, the demographic groups most similar to Maltese are Zimbabwean (4.1%, a difference of 0.030%), Immigrants from Ireland (4.1%, a difference of 0.25%), Immigrants from Singapore (4.1%, a difference of 0.40%), Bhutanese (4.1%, a difference of 0.42%), and Eastern European (4.1%, a difference of 0.65%).
| Demographics | Rating | Rank | Married-Couple Family Poverty |
| Czechs | 100.0 /100 | #13 | Exceptional 4.0% |
| Slovaks | 100.0 /100 | #14 | Exceptional 4.0% |
| Poles | 100.0 /100 | #15 | Exceptional 4.0% |
| Germans | 100.0 /100 | #16 | Exceptional 4.0% |
| Filipinos | 100.0 /100 | #17 | Exceptional 4.0% |
| Italians | 100.0 /100 | #18 | Exceptional 4.0% |
| Immigrants | Ireland | 99.9 /100 | #19 | Exceptional 4.1% |
| Maltese | 99.9 /100 | #20 | Exceptional 4.1% |
| Zimbabweans | 99.9 /100 | #21 | Exceptional 4.1% |
| Immigrants | Singapore | 99.9 /100 | #22 | Exceptional 4.1% |
| Bhutanese | 99.9 /100 | #23 | Exceptional 4.1% |
| Eastern Europeans | 99.9 /100 | #24 | Exceptional 4.1% |
| Immigrants | Taiwan | 99.9 /100 | #25 | Exceptional 4.1% |
| Cypriots | 99.9 /100 | #26 | Exceptional 4.1% |
| Danes | 99.9 /100 | #27 | Exceptional 4.1% |
Demographics Similar to Trinidadians and Tobagonians by Married-Couple Family Poverty
In terms of married-couple family poverty, the demographic groups most similar to Trinidadians and Tobagonians are Immigrants from Bahamas (6.2%, a difference of 0.030%), Immigrants from Jamaica (6.2%, a difference of 0.25%), Immigrants from West Indies (6.2%, a difference of 0.29%), Alaska Native (6.2%, a difference of 0.46%), and Colville (6.3%, a difference of 0.78%).
| Demographics | Rating | Rank | Married-Couple Family Poverty |
| Blackfeet | 0.2 /100 | #265 | Tragic 6.2% |
| Creek | 0.2 /100 | #266 | Tragic 6.2% |
| Spanish Americans | 0.2 /100 | #267 | Tragic 6.2% |
| Alaska Natives | 0.2 /100 | #268 | Tragic 6.2% |
| Immigrants | West Indies | 0.1 /100 | #269 | Tragic 6.2% |
| Immigrants | Jamaica | 0.1 /100 | #270 | Tragic 6.2% |
| Immigrants | Bahamas | 0.1 /100 | #271 | Tragic 6.2% |
| Trinidadians and Tobagonians | 0.1 /100 | #272 | Tragic 6.2% |
| Colville | 0.1 /100 | #273 | Tragic 6.3% |
| Barbadians | 0.1 /100 | #274 | Tragic 6.3% |
| Choctaw | 0.1 /100 | #275 | Tragic 6.3% |
| Yaqui | 0.1 /100 | #276 | Tragic 6.3% |
| Indonesians | 0.1 /100 | #277 | Tragic 6.3% |
| Immigrants | Trinidad and Tobago | 0.1 /100 | #278 | Tragic 6.4% |
| Houma | 0.0 /100 | #279 | Tragic 6.4% |