Sioux vs Puget Sound Salish Married-Couple Family Poverty
COMPARE
Sioux
Puget Sound Salish
Married-Couple Family Poverty
Married-Couple Family Poverty Comparison
Sioux
Puget Sound Salish
8.7%
MARRIED-COUPLE FAMILY POVERTY
0.0/ 100
METRIC RATING
335th/ 347
METRIC RANK
4.9%
MARRIED-COUPLE FAMILY POVERTY
90.4/ 100
METRIC RATING
132nd/ 347
METRIC RANK
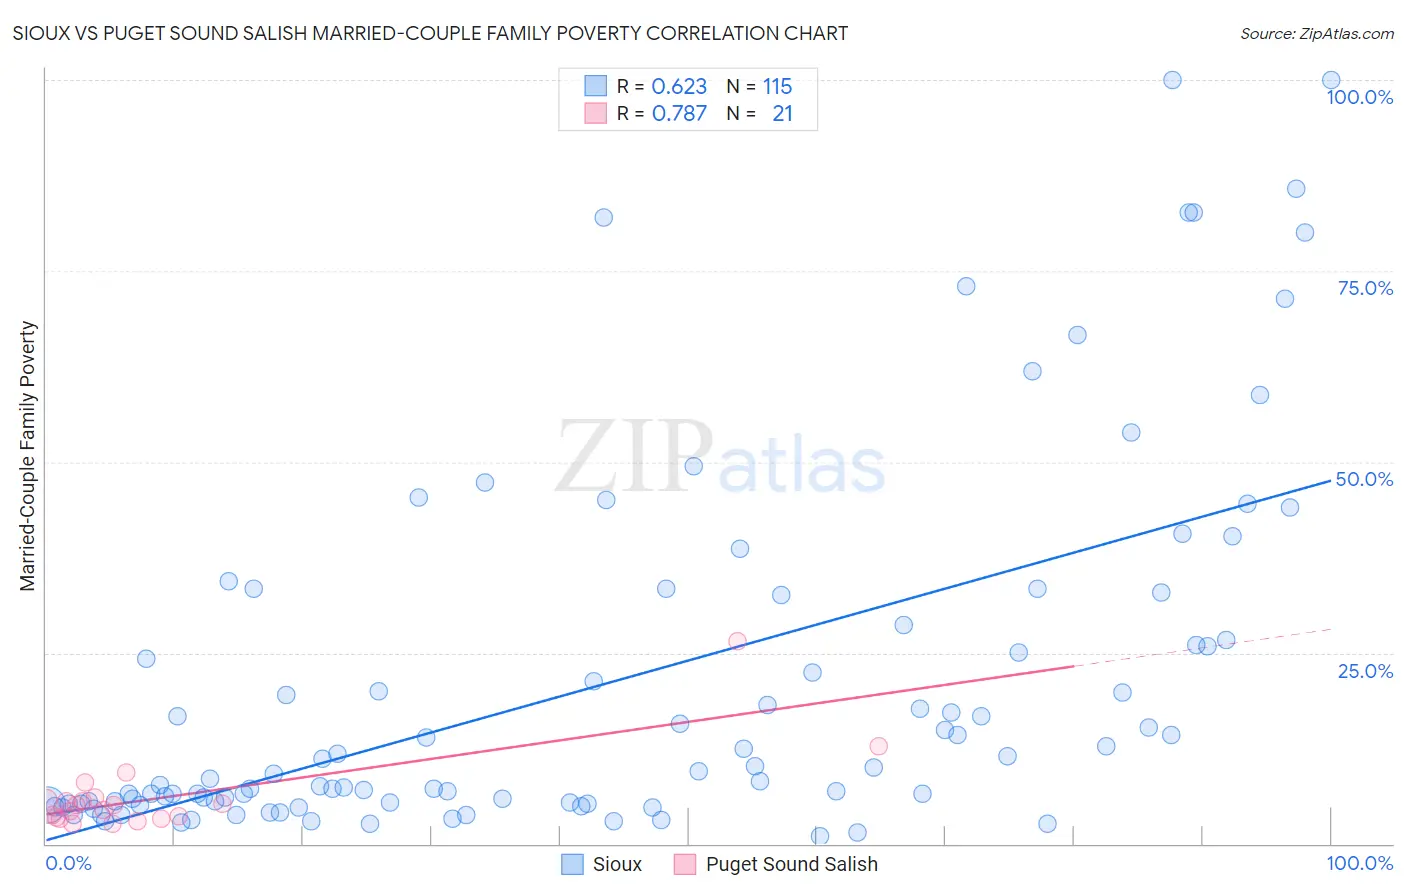
Sioux vs Puget Sound Salish Married-Couple Family Poverty Correlation Chart
The statistical analysis conducted on geographies consisting of 232,751,965 people shows a significant positive correlation between the proportion of Sioux and poverty level among married-couple families in the United States with a correlation coefficient (R) of 0.623 and weighted average of 8.7%. Similarly, the statistical analysis conducted on geographies consisting of 46,044,429 people shows a strong positive correlation between the proportion of Puget Sound Salish and poverty level among married-couple families in the United States with a correlation coefficient (R) of 0.787 and weighted average of 4.9%, a difference of 78.3%.
Married-Couple Family Poverty Correlation Summary
| Measurement | Sioux | Puget Sound Salish |
| Minimum | 0.94% | 2.7% |
| Maximum | 100.0% | 26.4% |
| Range | 99.1% | 23.8% |
| Mean | 21.0% | 6.1% |
| Median | 9.4% | 5.1% |
| Interquartile 25% (IQ1) | 5.3% | 3.4% |
| Interquartile 75% (IQ3) | 28.6% | 5.8% |
| Interquartile Range (IQR) | 23.3% | 2.5% |
| Standard Deviation (Sample) | 23.8% | 5.2% |
| Standard Deviation (Population) | 23.7% | 5.1% |
Similar Demographics by Married-Couple Family Poverty
Demographics Similar to Sioux by Married-Couple Family Poverty
In terms of married-couple family poverty, the demographic groups most similar to Sioux are Apache (9.0%, a difference of 2.9%), Yakama (9.0%, a difference of 3.0%), Immigrants from Dominican Republic (8.4%, a difference of 3.6%), Lumbee (8.3%, a difference of 4.3%), and Dominican (8.3%, a difference of 4.8%).
| Demographics | Rating | Rank | Married-Couple Family Poverty |
| Immigrants | Mexico | 0.0 /100 | #328 | Tragic 7.6% |
| Natives/Alaskans | 0.0 /100 | #329 | Tragic 8.2% |
| Paiute | 0.0 /100 | #330 | Tragic 8.3% |
| Central American Indians | 0.0 /100 | #331 | Tragic 8.3% |
| Dominicans | 0.0 /100 | #332 | Tragic 8.3% |
| Lumbee | 0.0 /100 | #333 | Tragic 8.3% |
| Immigrants | Dominican Republic | 0.0 /100 | #334 | Tragic 8.4% |
| Sioux | 0.0 /100 | #335 | Tragic 8.7% |
| Apache | 0.0 /100 | #336 | Tragic 9.0% |
| Yakama | 0.0 /100 | #337 | Tragic 9.0% |
| Cheyenne | 0.0 /100 | #338 | Tragic 9.4% |
| Crow | 0.0 /100 | #339 | Tragic 9.6% |
| Yuman | 0.0 /100 | #340 | Tragic 9.7% |
| Pueblo | 0.0 /100 | #341 | Tragic 11.1% |
| Tohono O'odham | 0.0 /100 | #342 | Tragic 11.2% |
Demographics Similar to Puget Sound Salish by Married-Couple Family Poverty
In terms of married-couple family poverty, the demographic groups most similar to Puget Sound Salish are Immigrants from Eastern Europe (4.9%, a difference of 0.010%), Immigrants from Kenya (4.9%, a difference of 0.070%), Soviet Union (4.9%, a difference of 0.080%), Samoan (4.9%, a difference of 0.080%), and Immigrants from Pakistan (4.9%, a difference of 0.090%).
| Demographics | Rating | Rank | Married-Couple Family Poverty |
| Immigrants | Bosnia and Herzegovina | 92.5 /100 | #125 | Exceptional 4.8% |
| Immigrants | Asia | 92.3 /100 | #126 | Exceptional 4.8% |
| Egyptians | 92.0 /100 | #127 | Exceptional 4.8% |
| Palestinians | 91.2 /100 | #128 | Exceptional 4.9% |
| Immigrants | Pakistan | 90.7 /100 | #129 | Exceptional 4.9% |
| Soviet Union | 90.7 /100 | #130 | Exceptional 4.9% |
| Immigrants | Eastern Europe | 90.5 /100 | #131 | Exceptional 4.9% |
| Puget Sound Salish | 90.4 /100 | #132 | Exceptional 4.9% |
| Immigrants | Kenya | 90.2 /100 | #133 | Exceptional 4.9% |
| Samoans | 90.2 /100 | #134 | Exceptional 4.9% |
| Assyrians/Chaldeans/Syriacs | 89.4 /100 | #135 | Excellent 4.9% |
| Immigrants | Hungary | 88.7 /100 | #136 | Excellent 4.9% |
| Guamanians/Chamorros | 86.5 /100 | #137 | Excellent 4.9% |
| Chileans | 86.0 /100 | #138 | Excellent 4.9% |
| German Russians | 85.1 /100 | #139 | Excellent 5.0% |