Sioux vs Immigrants from St. Vincent and the Grenadines Married-Couple Family Poverty
COMPARE
Sioux
Immigrants from St. Vincent and the Grenadines
Married-Couple Family Poverty
Married-Couple Family Poverty Comparison
Sioux
Immigrants from St. Vincent and the Grenadines
8.7%
MARRIED-COUPLE FAMILY POVERTY
0.0/ 100
METRIC RATING
335th/ 347
METRIC RANK
7.1%
MARRIED-COUPLE FAMILY POVERTY
0.0/ 100
METRIC RATING
313th/ 347
METRIC RANK
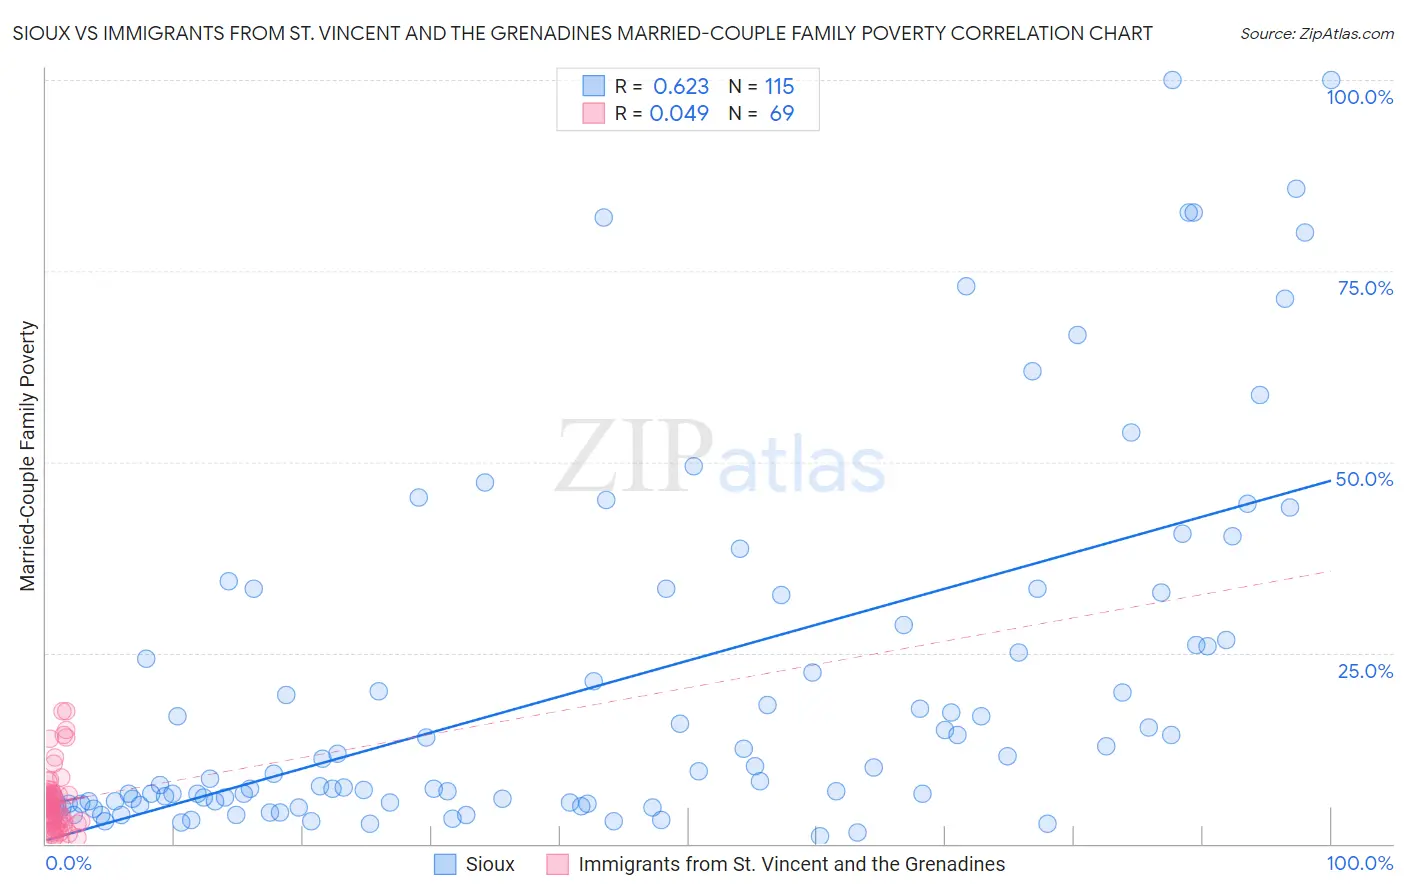
Sioux vs Immigrants from St. Vincent and the Grenadines Married-Couple Family Poverty Correlation Chart
The statistical analysis conducted on geographies consisting of 232,751,965 people shows a significant positive correlation between the proportion of Sioux and poverty level among married-couple families in the United States with a correlation coefficient (R) of 0.623 and weighted average of 8.7%. Similarly, the statistical analysis conducted on geographies consisting of 56,063,959 people shows no correlation between the proportion of Immigrants from St. Vincent and the Grenadines and poverty level among married-couple families in the United States with a correlation coefficient (R) of 0.049 and weighted average of 7.1%, a difference of 22.4%.
Married-Couple Family Poverty Correlation Summary
| Measurement | Sioux | Immigrants from St. Vincent and the Grenadines |
| Minimum | 0.94% | 0.34% |
| Maximum | 100.0% | 17.4% |
| Range | 99.1% | 17.1% |
| Mean | 21.0% | 5.4% |
| Median | 9.4% | 4.9% |
| Interquartile 25% (IQ1) | 5.3% | 2.8% |
| Interquartile 75% (IQ3) | 28.6% | 6.5% |
| Interquartile Range (IQR) | 23.3% | 3.7% |
| Standard Deviation (Sample) | 23.8% | 3.8% |
| Standard Deviation (Population) | 23.7% | 3.8% |
Similar Demographics by Married-Couple Family Poverty
Demographics Similar to Sioux by Married-Couple Family Poverty
In terms of married-couple family poverty, the demographic groups most similar to Sioux are Apache (9.0%, a difference of 2.9%), Yakama (9.0%, a difference of 3.0%), Immigrants from Dominican Republic (8.4%, a difference of 3.6%), Lumbee (8.3%, a difference of 4.3%), and Dominican (8.3%, a difference of 4.8%).
| Demographics | Rating | Rank | Married-Couple Family Poverty |
| Immigrants | Mexico | 0.0 /100 | #328 | Tragic 7.6% |
| Natives/Alaskans | 0.0 /100 | #329 | Tragic 8.2% |
| Paiute | 0.0 /100 | #330 | Tragic 8.3% |
| Central American Indians | 0.0 /100 | #331 | Tragic 8.3% |
| Dominicans | 0.0 /100 | #332 | Tragic 8.3% |
| Lumbee | 0.0 /100 | #333 | Tragic 8.3% |
| Immigrants | Dominican Republic | 0.0 /100 | #334 | Tragic 8.4% |
| Sioux | 0.0 /100 | #335 | Tragic 8.7% |
| Apache | 0.0 /100 | #336 | Tragic 9.0% |
| Yakama | 0.0 /100 | #337 | Tragic 9.0% |
| Cheyenne | 0.0 /100 | #338 | Tragic 9.4% |
| Crow | 0.0 /100 | #339 | Tragic 9.6% |
| Yuman | 0.0 /100 | #340 | Tragic 9.7% |
| Pueblo | 0.0 /100 | #341 | Tragic 11.1% |
| Tohono O'odham | 0.0 /100 | #342 | Tragic 11.2% |
Demographics Similar to Immigrants from St. Vincent and the Grenadines by Married-Couple Family Poverty
In terms of married-couple family poverty, the demographic groups most similar to Immigrants from St. Vincent and the Grenadines are Immigrants from Dominica (7.1%, a difference of 0.11%), Immigrants from Armenia (7.1%, a difference of 0.11%), Immigrants from Nicaragua (7.1%, a difference of 0.17%), Hopi (7.1%, a difference of 0.19%), and British West Indian (7.1%, a difference of 0.30%).
| Demographics | Rating | Rank | Married-Couple Family Poverty |
| Immigrants | Haiti | 0.0 /100 | #306 | Tragic 7.0% |
| Guatemalans | 0.0 /100 | #307 | Tragic 7.0% |
| Spanish American Indians | 0.0 /100 | #308 | Tragic 7.1% |
| Hopi | 0.0 /100 | #309 | Tragic 7.1% |
| Immigrants | Nicaragua | 0.0 /100 | #310 | Tragic 7.1% |
| Immigrants | Dominica | 0.0 /100 | #311 | Tragic 7.1% |
| Immigrants | Armenia | 0.0 /100 | #312 | Tragic 7.1% |
| Immigrants | St. Vincent and the Grenadines | 0.0 /100 | #313 | Tragic 7.1% |
| British West Indians | 0.0 /100 | #314 | Tragic 7.1% |
| Inupiat | 0.0 /100 | #315 | Tragic 7.1% |
| Hondurans | 0.0 /100 | #316 | Tragic 7.2% |
| Mexicans | 0.0 /100 | #317 | Tragic 7.2% |
| Immigrants | Guatemala | 0.0 /100 | #318 | Tragic 7.2% |
| Immigrants | Latin America | 0.0 /100 | #319 | Tragic 7.2% |
| Immigrants | Grenada | 0.0 /100 | #320 | Tragic 7.3% |