Sioux vs Immigrants from Grenada Married-Couple Family Poverty
COMPARE
Sioux
Immigrants from Grenada
Married-Couple Family Poverty
Married-Couple Family Poverty Comparison
Sioux
Immigrants from Grenada
8.7%
MARRIED-COUPLE FAMILY POVERTY
0.0/ 100
METRIC RATING
335th/ 347
METRIC RANK
7.3%
MARRIED-COUPLE FAMILY POVERTY
0.0/ 100
METRIC RATING
320th/ 347
METRIC RANK
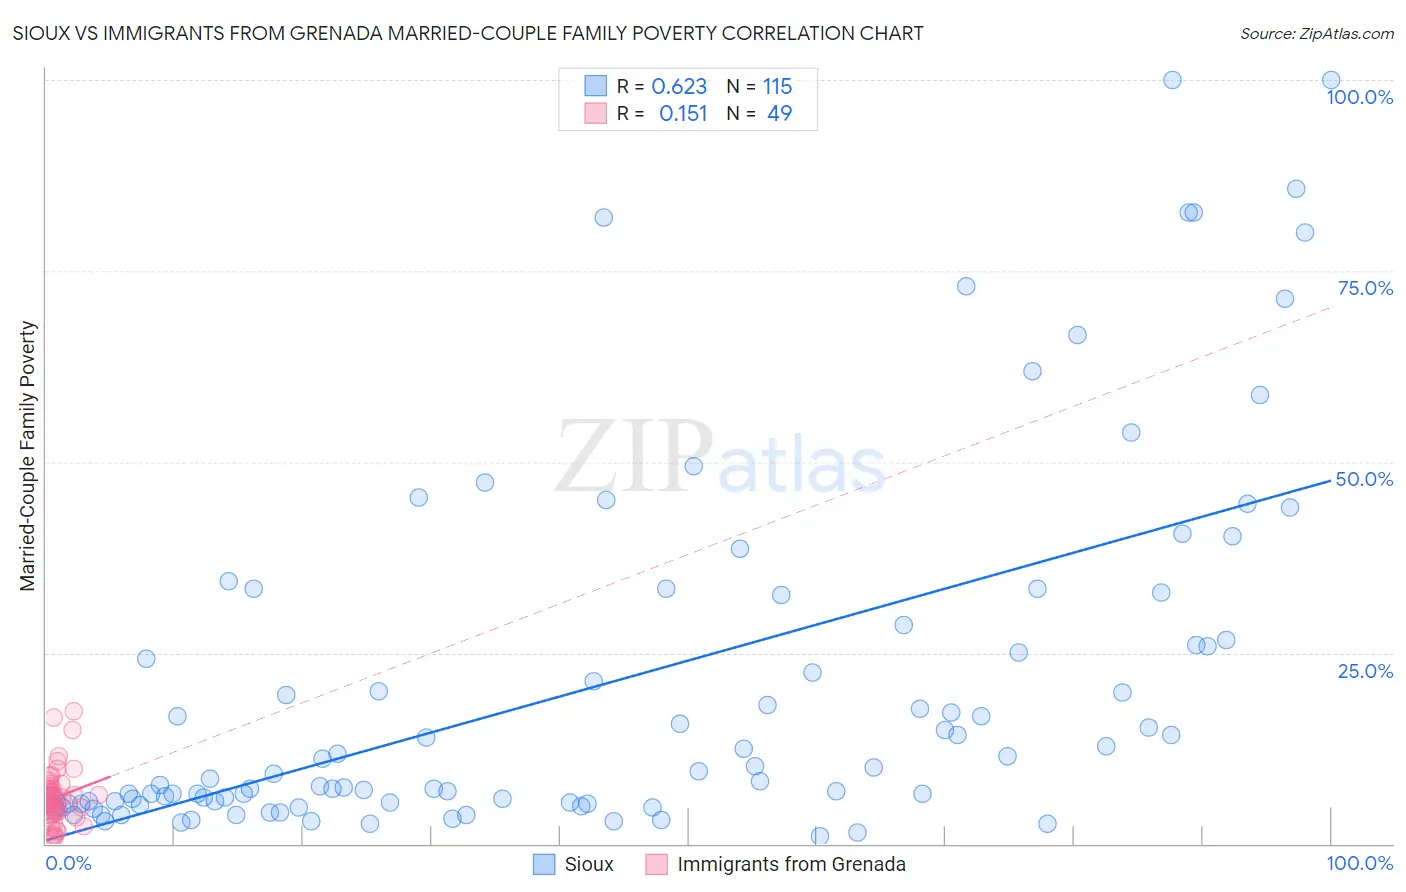
Sioux vs Immigrants from Grenada Married-Couple Family Poverty Correlation Chart
The statistical analysis conducted on geographies consisting of 232,751,965 people shows a significant positive correlation between the proportion of Sioux and poverty level among married-couple families in the United States with a correlation coefficient (R) of 0.623 and weighted average of 8.7%. Similarly, the statistical analysis conducted on geographies consisting of 67,074,791 people shows a poor positive correlation between the proportion of Immigrants from Grenada and poverty level among married-couple families in the United States with a correlation coefficient (R) of 0.151 and weighted average of 7.3%, a difference of 19.4%.
Married-Couple Family Poverty Correlation Summary
| Measurement | Sioux | Immigrants from Grenada |
| Minimum | 0.94% | 0.79% |
| Maximum | 100.0% | 17.4% |
| Range | 99.1% | 16.6% |
| Mean | 21.0% | 6.1% |
| Median | 9.4% | 5.7% |
| Interquartile 25% (IQ1) | 5.3% | 4.0% |
| Interquartile 75% (IQ3) | 28.6% | 7.7% |
| Interquartile Range (IQR) | 23.3% | 3.8% |
| Standard Deviation (Sample) | 23.8% | 3.7% |
| Standard Deviation (Population) | 23.7% | 3.7% |
Demographics Similar to Sioux and Immigrants from Grenada by Married-Couple Family Poverty
In terms of married-couple family poverty, the demographic groups most similar to Sioux are Apache (9.0%, a difference of 2.9%), Yakama (9.0%, a difference of 3.0%), Immigrants from Dominican Republic (8.4%, a difference of 3.6%), Lumbee (8.3%, a difference of 4.3%), and Dominican (8.3%, a difference of 4.8%). Similarly, the demographic groups most similar to Immigrants from Grenada are Immigrants from Caribbean (7.3%, a difference of 0.77%), Immigrants from Honduras (7.3%, a difference of 0.79%), Immigrants from Latin America (7.2%, a difference of 1.2%), Immigrants from Guatemala (7.2%, a difference of 1.4%), and Mexican (7.2%, a difference of 1.5%).
| Demographics | Rating | Rank | Married-Couple Family Poverty |
| Mexicans | 0.0 /100 | #317 | Tragic 7.2% |
| Immigrants | Guatemala | 0.0 /100 | #318 | Tragic 7.2% |
| Immigrants | Latin America | 0.0 /100 | #319 | Tragic 7.2% |
| Immigrants | Grenada | 0.0 /100 | #320 | Tragic 7.3% |
| Immigrants | Caribbean | 0.0 /100 | #321 | Tragic 7.3% |
| Immigrants | Honduras | 0.0 /100 | #322 | Tragic 7.3% |
| Vietnamese | 0.0 /100 | #323 | Tragic 7.4% |
| Immigrants | Central America | 0.0 /100 | #324 | Tragic 7.4% |
| Immigrants | Cuba | 0.0 /100 | #325 | Tragic 7.5% |
| Immigrants | Bangladesh | 0.0 /100 | #326 | Tragic 7.5% |
| Hispanics or Latinos | 0.0 /100 | #327 | Tragic 7.5% |
| Immigrants | Mexico | 0.0 /100 | #328 | Tragic 7.6% |
| Natives/Alaskans | 0.0 /100 | #329 | Tragic 8.2% |
| Paiute | 0.0 /100 | #330 | Tragic 8.3% |
| Central American Indians | 0.0 /100 | #331 | Tragic 8.3% |
| Dominicans | 0.0 /100 | #332 | Tragic 8.3% |
| Lumbee | 0.0 /100 | #333 | Tragic 8.3% |
| Immigrants | Dominican Republic | 0.0 /100 | #334 | Tragic 8.4% |
| Sioux | 0.0 /100 | #335 | Tragic 8.7% |
| Apache | 0.0 /100 | #336 | Tragic 9.0% |
| Yakama | 0.0 /100 | #337 | Tragic 9.0% |