Scottish vs Puget Sound Salish Married-Couple Family Poverty
COMPARE
Scottish
Puget Sound Salish
Married-Couple Family Poverty
Married-Couple Family Poverty Comparison
Scottish
Puget Sound Salish
4.3%
MARRIED-COUPLE FAMILY POVERTY
99.8/ 100
METRIC RATING
42nd/ 347
METRIC RANK
4.9%
MARRIED-COUPLE FAMILY POVERTY
90.4/ 100
METRIC RATING
132nd/ 347
METRIC RANK
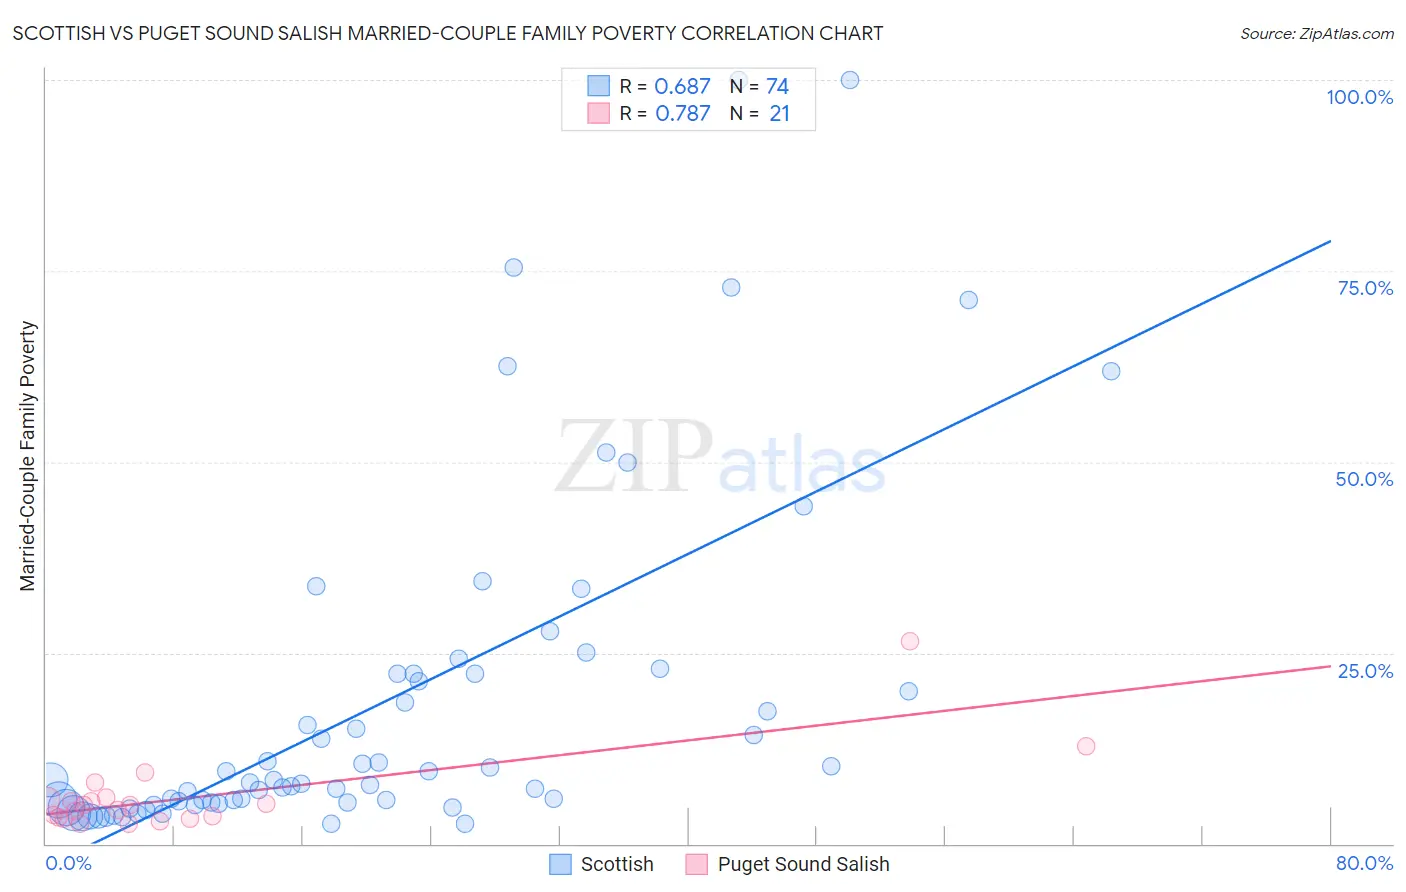
Scottish vs Puget Sound Salish Married-Couple Family Poverty Correlation Chart
The statistical analysis conducted on geographies consisting of 552,662,179 people shows a significant positive correlation between the proportion of Scottish and poverty level among married-couple families in the United States with a correlation coefficient (R) of 0.687 and weighted average of 4.3%. Similarly, the statistical analysis conducted on geographies consisting of 46,044,429 people shows a strong positive correlation between the proportion of Puget Sound Salish and poverty level among married-couple families in the United States with a correlation coefficient (R) of 0.787 and weighted average of 4.9%, a difference of 14.3%.
Married-Couple Family Poverty Correlation Summary
| Measurement | Scottish | Puget Sound Salish |
| Minimum | 2.6% | 2.7% |
| Maximum | 100.0% | 26.4% |
| Range | 97.4% | 23.8% |
| Mean | 18.6% | 6.1% |
| Median | 8.2% | 5.1% |
| Interquartile 25% (IQ1) | 5.4% | 3.4% |
| Interquartile 75% (IQ3) | 22.2% | 5.8% |
| Interquartile Range (IQR) | 16.8% | 2.5% |
| Standard Deviation (Sample) | 22.5% | 5.2% |
| Standard Deviation (Population) | 22.4% | 5.1% |
Similar Demographics by Married-Couple Family Poverty
Demographics Similar to Scottish by Married-Couple Family Poverty
In terms of married-couple family poverty, the demographic groups most similar to Scottish are Northern European (4.3%, a difference of 0.16%), French Canadian (4.2%, a difference of 0.41%), Swiss (4.3%, a difference of 0.44%), Immigrants from Northern Europe (4.2%, a difference of 0.70%), and Immigrants from Japan (4.3%, a difference of 0.81%).
| Demographics | Rating | Rank | Married-Couple Family Poverty |
| Europeans | 99.9 /100 | #35 | Exceptional 4.2% |
| English | 99.9 /100 | #36 | Exceptional 4.2% |
| Iranians | 99.9 /100 | #37 | Exceptional 4.2% |
| Belgians | 99.9 /100 | #38 | Exceptional 4.2% |
| Immigrants | Northern Europe | 99.8 /100 | #39 | Exceptional 4.2% |
| French Canadians | 99.8 /100 | #40 | Exceptional 4.2% |
| Northern Europeans | 99.8 /100 | #41 | Exceptional 4.3% |
| Scottish | 99.8 /100 | #42 | Exceptional 4.3% |
| Swiss | 99.8 /100 | #43 | Exceptional 4.3% |
| Immigrants | Japan | 99.8 /100 | #44 | Exceptional 4.3% |
| Serbians | 99.8 /100 | #45 | Exceptional 4.3% |
| British | 99.8 /100 | #46 | Exceptional 4.3% |
| Immigrants | South Central Asia | 99.8 /100 | #47 | Exceptional 4.3% |
| Australians | 99.7 /100 | #48 | Exceptional 4.3% |
| Turks | 99.7 /100 | #49 | Exceptional 4.3% |
Demographics Similar to Puget Sound Salish by Married-Couple Family Poverty
In terms of married-couple family poverty, the demographic groups most similar to Puget Sound Salish are Immigrants from Eastern Europe (4.9%, a difference of 0.010%), Immigrants from Kenya (4.9%, a difference of 0.070%), Soviet Union (4.9%, a difference of 0.080%), Samoan (4.9%, a difference of 0.080%), and Immigrants from Pakistan (4.9%, a difference of 0.090%).
| Demographics | Rating | Rank | Married-Couple Family Poverty |
| Immigrants | Bosnia and Herzegovina | 92.5 /100 | #125 | Exceptional 4.8% |
| Immigrants | Asia | 92.3 /100 | #126 | Exceptional 4.8% |
| Egyptians | 92.0 /100 | #127 | Exceptional 4.8% |
| Palestinians | 91.2 /100 | #128 | Exceptional 4.9% |
| Immigrants | Pakistan | 90.7 /100 | #129 | Exceptional 4.9% |
| Soviet Union | 90.7 /100 | #130 | Exceptional 4.9% |
| Immigrants | Eastern Europe | 90.5 /100 | #131 | Exceptional 4.9% |
| Puget Sound Salish | 90.4 /100 | #132 | Exceptional 4.9% |
| Immigrants | Kenya | 90.2 /100 | #133 | Exceptional 4.9% |
| Samoans | 90.2 /100 | #134 | Exceptional 4.9% |
| Assyrians/Chaldeans/Syriacs | 89.4 /100 | #135 | Excellent 4.9% |
| Immigrants | Hungary | 88.7 /100 | #136 | Excellent 4.9% |
| Guamanians/Chamorros | 86.5 /100 | #137 | Excellent 4.9% |
| Chileans | 86.0 /100 | #138 | Excellent 4.9% |
| German Russians | 85.1 /100 | #139 | Excellent 5.0% |