Mongolian vs Immigrants from Singapore Married-Couple Family Poverty
COMPARE
Mongolian
Immigrants from Singapore
Married-Couple Family Poverty
Married-Couple Family Poverty Comparison
Mongolians
Immigrants from Singapore
5.0%
MARRIED-COUPLE FAMILY POVERTY
79.8/ 100
METRIC RATING
146th/ 347
METRIC RANK
4.1%
MARRIED-COUPLE FAMILY POVERTY
99.9/ 100
METRIC RATING
22nd/ 347
METRIC RANK
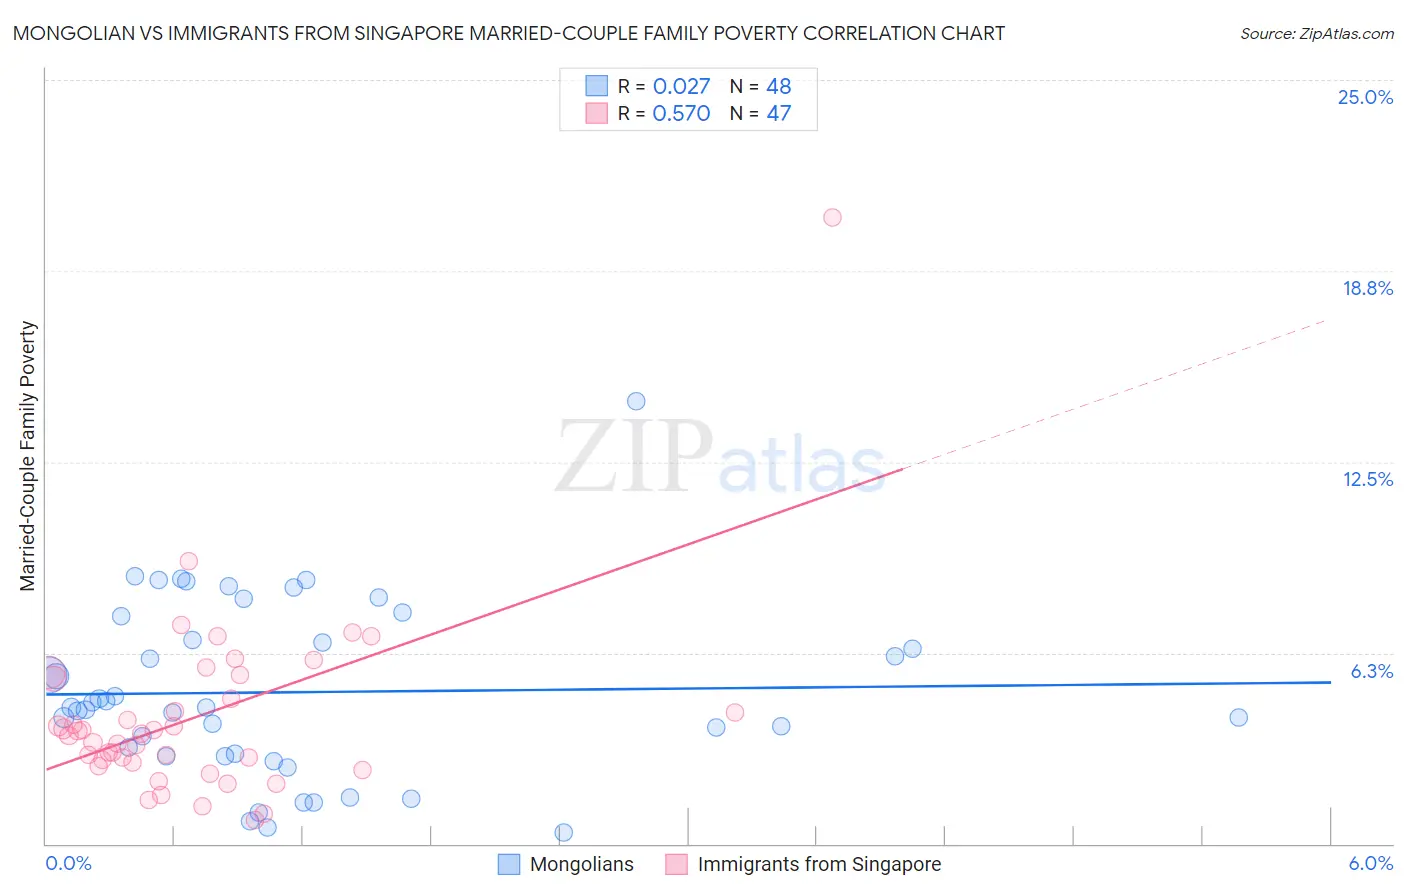
Mongolian vs Immigrants from Singapore Married-Couple Family Poverty Correlation Chart
The statistical analysis conducted on geographies consisting of 139,875,395 people shows no correlation between the proportion of Mongolians and poverty level among married-couple families in the United States with a correlation coefficient (R) of 0.027 and weighted average of 5.0%. Similarly, the statistical analysis conducted on geographies consisting of 136,997,668 people shows a substantial positive correlation between the proportion of Immigrants from Singapore and poverty level among married-couple families in the United States with a correlation coefficient (R) of 0.570 and weighted average of 4.1%, a difference of 22.4%.
Married-Couple Family Poverty Correlation Summary
| Measurement | Mongolian | Immigrants from Singapore |
| Minimum | 0.35% | 0.78% |
| Maximum | 14.5% | 20.5% |
| Range | 14.1% | 19.7% |
| Mean | 5.0% | 4.1% |
| Median | 4.5% | 3.6% |
| Interquartile 25% (IQ1) | 2.9% | 2.6% |
| Interquartile 75% (IQ3) | 7.1% | 5.4% |
| Interquartile Range (IQR) | 4.1% | 2.8% |
| Standard Deviation (Sample) | 2.9% | 3.0% |
| Standard Deviation (Population) | 2.8% | 3.0% |
Similar Demographics by Married-Couple Family Poverty
Demographics Similar to Mongolians by Married-Couple Family Poverty
In terms of married-couple family poverty, the demographic groups most similar to Mongolians are Immigrants from Spain (5.0%, a difference of 0.020%), Syrian (5.0%, a difference of 0.19%), Immigrants from Russia (5.0%, a difference of 0.20%), Immigrants from Oceania (5.0%, a difference of 0.22%), and Brazilian (5.0%, a difference of 0.27%).
| Demographics | Rating | Rank | Married-Couple Family Poverty |
| German Russians | 85.1 /100 | #139 | Excellent 5.0% |
| Immigrants | Portugal | 84.8 /100 | #140 | Excellent 5.0% |
| Immigrants | Brazil | 84.6 /100 | #141 | Excellent 5.0% |
| Immigrants | China | 84.6 /100 | #142 | Excellent 5.0% |
| Immigrants | Egypt | 83.4 /100 | #143 | Excellent 5.0% |
| Hmong | 83.2 /100 | #144 | Excellent 5.0% |
| Immigrants | Spain | 79.9 /100 | #145 | Good 5.0% |
| Mongolians | 79.8 /100 | #146 | Good 5.0% |
| Syrians | 78.7 /100 | #147 | Good 5.0% |
| Immigrants | Russia | 78.7 /100 | #148 | Good 5.0% |
| Immigrants | Oceania | 78.6 /100 | #149 | Good 5.0% |
| Brazilians | 78.3 /100 | #150 | Good 5.0% |
| Immigrants | Cameroon | 77.3 /100 | #151 | Good 5.0% |
| Albanians | 77.2 /100 | #152 | Good 5.0% |
| Immigrants | Kuwait | 76.3 /100 | #153 | Good 5.0% |
Demographics Similar to Immigrants from Singapore by Married-Couple Family Poverty
In terms of married-couple family poverty, the demographic groups most similar to Immigrants from Singapore are Bhutanese (4.1%, a difference of 0.020%), Eastern European (4.1%, a difference of 0.26%), Zimbabwean (4.1%, a difference of 0.37%), Maltese (4.1%, a difference of 0.40%), and Immigrants from Ireland (4.1%, a difference of 0.64%).
| Demographics | Rating | Rank | Married-Couple Family Poverty |
| Poles | 100.0 /100 | #15 | Exceptional 4.0% |
| Germans | 100.0 /100 | #16 | Exceptional 4.0% |
| Filipinos | 100.0 /100 | #17 | Exceptional 4.0% |
| Italians | 100.0 /100 | #18 | Exceptional 4.0% |
| Immigrants | Ireland | 99.9 /100 | #19 | Exceptional 4.1% |
| Maltese | 99.9 /100 | #20 | Exceptional 4.1% |
| Zimbabweans | 99.9 /100 | #21 | Exceptional 4.1% |
| Immigrants | Singapore | 99.9 /100 | #22 | Exceptional 4.1% |
| Bhutanese | 99.9 /100 | #23 | Exceptional 4.1% |
| Eastern Europeans | 99.9 /100 | #24 | Exceptional 4.1% |
| Immigrants | Taiwan | 99.9 /100 | #25 | Exceptional 4.1% |
| Cypriots | 99.9 /100 | #26 | Exceptional 4.1% |
| Danes | 99.9 /100 | #27 | Exceptional 4.1% |
| Scandinavians | 99.9 /100 | #28 | Exceptional 4.1% |
| Immigrants | Scotland | 99.9 /100 | #29 | Exceptional 4.2% |