Mongolian vs Immigrants from Belize Married-Couple Family Poverty
COMPARE
Mongolian
Immigrants from Belize
Married-Couple Family Poverty
Married-Couple Family Poverty Comparison
Mongolians
Immigrants from Belize
5.0%
MARRIED-COUPLE FAMILY POVERTY
79.8/ 100
METRIC RATING
146th/ 347
METRIC RANK
6.7%
MARRIED-COUPLE FAMILY POVERTY
0.0/ 100
METRIC RATING
300th/ 347
METRIC RANK
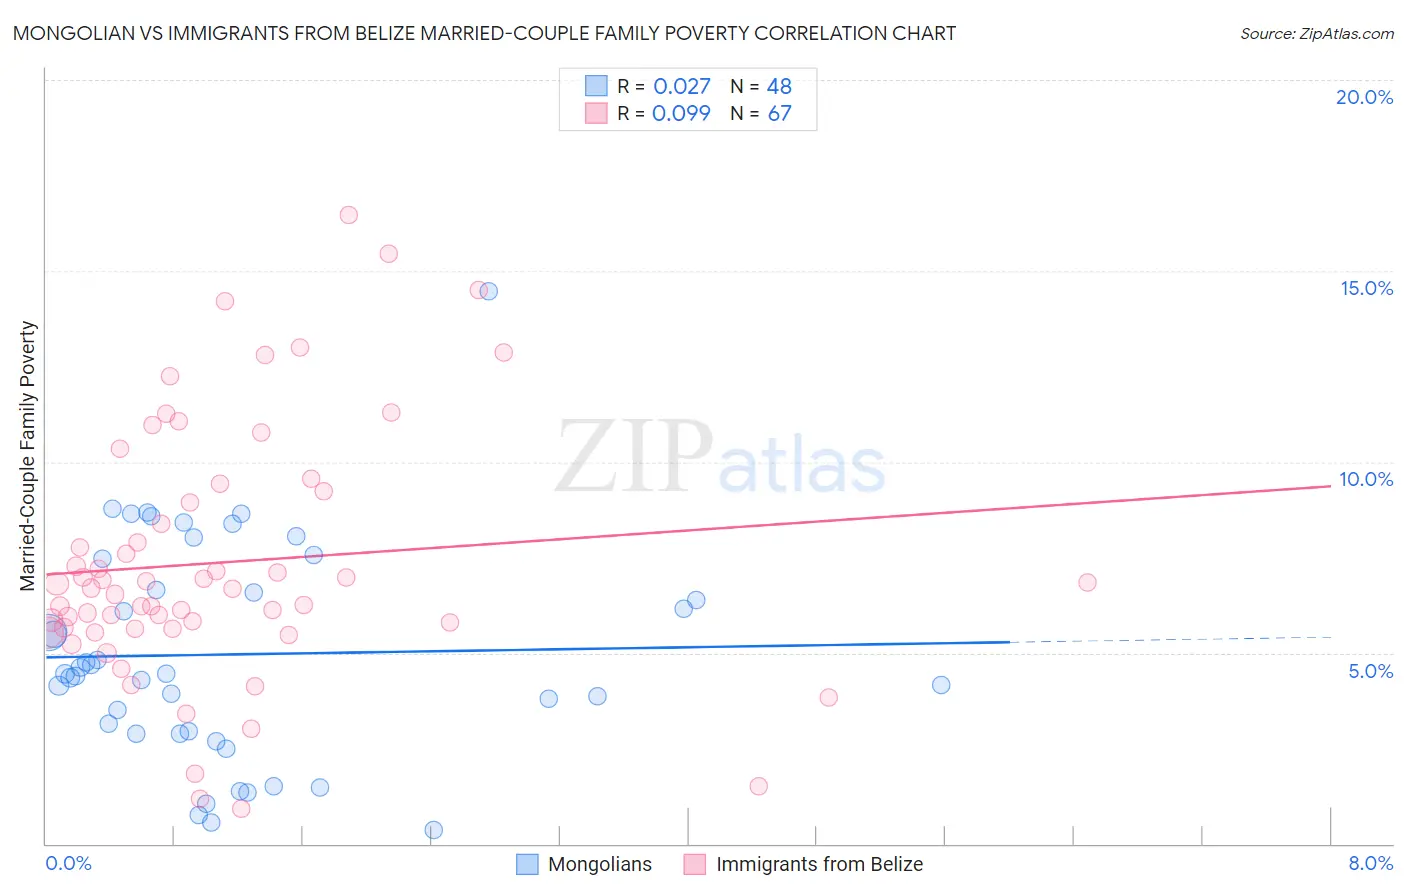
Mongolian vs Immigrants from Belize Married-Couple Family Poverty Correlation Chart
The statistical analysis conducted on geographies consisting of 139,875,395 people shows no correlation between the proportion of Mongolians and poverty level among married-couple families in the United States with a correlation coefficient (R) of 0.027 and weighted average of 5.0%. Similarly, the statistical analysis conducted on geographies consisting of 130,147,118 people shows a slight positive correlation between the proportion of Immigrants from Belize and poverty level among married-couple families in the United States with a correlation coefficient (R) of 0.099 and weighted average of 6.7%, a difference of 33.7%.
Married-Couple Family Poverty Correlation Summary
| Measurement | Mongolian | Immigrants from Belize |
| Minimum | 0.35% | 0.90% |
| Maximum | 14.5% | 16.5% |
| Range | 14.1% | 15.6% |
| Mean | 5.0% | 7.4% |
| Median | 4.5% | 6.7% |
| Interquartile 25% (IQ1) | 2.9% | 5.6% |
| Interquartile 75% (IQ3) | 7.1% | 9.2% |
| Interquartile Range (IQR) | 4.1% | 3.6% |
| Standard Deviation (Sample) | 2.9% | 3.3% |
| Standard Deviation (Population) | 2.8% | 3.3% |
Similar Demographics by Married-Couple Family Poverty
Demographics Similar to Mongolians by Married-Couple Family Poverty
In terms of married-couple family poverty, the demographic groups most similar to Mongolians are Immigrants from Spain (5.0%, a difference of 0.020%), Syrian (5.0%, a difference of 0.19%), Immigrants from Russia (5.0%, a difference of 0.20%), Immigrants from Oceania (5.0%, a difference of 0.22%), and Brazilian (5.0%, a difference of 0.27%).
| Demographics | Rating | Rank | Married-Couple Family Poverty |
| German Russians | 85.1 /100 | #139 | Excellent 5.0% |
| Immigrants | Portugal | 84.8 /100 | #140 | Excellent 5.0% |
| Immigrants | Brazil | 84.6 /100 | #141 | Excellent 5.0% |
| Immigrants | China | 84.6 /100 | #142 | Excellent 5.0% |
| Immigrants | Egypt | 83.4 /100 | #143 | Excellent 5.0% |
| Hmong | 83.2 /100 | #144 | Excellent 5.0% |
| Immigrants | Spain | 79.9 /100 | #145 | Good 5.0% |
| Mongolians | 79.8 /100 | #146 | Good 5.0% |
| Syrians | 78.7 /100 | #147 | Good 5.0% |
| Immigrants | Russia | 78.7 /100 | #148 | Good 5.0% |
| Immigrants | Oceania | 78.6 /100 | #149 | Good 5.0% |
| Brazilians | 78.3 /100 | #150 | Good 5.0% |
| Immigrants | Cameroon | 77.3 /100 | #151 | Good 5.0% |
| Albanians | 77.2 /100 | #152 | Good 5.0% |
| Immigrants | Kuwait | 76.3 /100 | #153 | Good 5.0% |
Demographics Similar to Immigrants from Belize by Married-Couple Family Poverty
In terms of married-couple family poverty, the demographic groups most similar to Immigrants from Belize are Nicaraguan (6.7%, a difference of 0.15%), Central American (6.7%, a difference of 0.60%), Immigrants from Guyana (6.7%, a difference of 0.69%), Immigrants from Ecuador (6.7%, a difference of 0.74%), and Kiowa (6.6%, a difference of 0.76%).
| Demographics | Rating | Rank | Married-Couple Family Poverty |
| Arapaho | 0.0 /100 | #293 | Tragic 6.6% |
| Bahamians | 0.0 /100 | #294 | Tragic 6.6% |
| Immigrants | Uzbekistan | 0.0 /100 | #295 | Tragic 6.6% |
| U.S. Virgin Islanders | 0.0 /100 | #296 | Tragic 6.6% |
| Kiowa | 0.0 /100 | #297 | Tragic 6.6% |
| Immigrants | Guyana | 0.0 /100 | #298 | Tragic 6.7% |
| Nicaraguans | 0.0 /100 | #299 | Tragic 6.7% |
| Immigrants | Belize | 0.0 /100 | #300 | Tragic 6.7% |
| Central Americans | 0.0 /100 | #301 | Tragic 6.7% |
| Immigrants | Ecuador | 0.0 /100 | #302 | Tragic 6.7% |
| Immigrants | El Salvador | 0.0 /100 | #303 | Tragic 6.8% |
| Cubans | 0.0 /100 | #304 | Tragic 6.8% |
| Haitians | 0.0 /100 | #305 | Tragic 6.8% |
| Immigrants | Haiti | 0.0 /100 | #306 | Tragic 7.0% |
| Guatemalans | 0.0 /100 | #307 | Tragic 7.0% |