Carpatho Rusyn vs Immigrants from Singapore Married-Couple Family Poverty

COMPARE

Carpatho Rusyn
Race
Ancestry
AfghanAfricanAlaska NativeAlaskan AthabascanAlbanianAleutAlsatianAmericanApacheArabArapahoArgentineanArmenianAssyrian/Chaldean/SyriacAustralianAustrianBahamianBangladeshiBarbadianBasqueBelgianBelizeanBermudanBhutaneseBlackfeetBolivianBrazilianBritishBritish West IndianBulgarianBurmeseCajunCambodianCanadianCape VerdeanCarpatho RusynCelticCentral AmericanCentral American IndianCherokeeCheyenneChickasawChileanChineseChippewaChoctawColombianColvilleComancheCosta RicanCreeCreekCroatianCrowCubanCypriotCzechCzechoslovakianDanishDelawareDominicanDutchDutch West IndianEastern EuropeanEcuadorianEgyptianEnglishEstonianEthiopianEuropeanFijianFilipinoFinnishFrenchFrench American IndianFrench CanadianGermanGerman RussianGhanaianGreekGuamanian/ChamorroGuatemalanGuyaneseHaitianHmongHonduranHopiHoumaHungarianIcelanderIndian (Asian)IndonesianInupiatIranianIraqiIrishIroquoisIsraeliItalianJamaicanJapaneseJordanianKenyanKiowaKoreanLaotianLatvianLebaneseLiberianLithuanianLumbeeLuxembourgerMacedonianMalaysianMalteseMarshalleseMenomineeMexicanMexican American IndianMongolianMoroccanNative HawaiianNavajoNepaleseNew ZealanderNicaraguanNigerianNorthern EuropeanNorwegianOkinawanOsageOttawaPaiutePakistaniPalestinianPanamanianParaguayanPennsylvania GermanPeruvianPimaPolishPortuguesePotawatomiPuebloPuerto RicanPuget Sound SalishRomanianRussianSalvadoranSamoanScandinavianScotch-IrishScottishSeminoleSenegaleseSerbianShoshoneSierra LeoneanSiouxSlavicSlovakSloveneSomaliSouth AfricanSouth AmericanSouth American IndianSoviet UnionSpaniardSpanishSpanish AmericanSpanish American IndianSri LankanSubsaharan AfricanSudaneseSwedishSwissSyrianTaiwaneseThaiTlingit-HaidaTohono O'OdhamTonganTrinidadian and TobagonianTsimshianTurkishU.S. Virgin IslanderUgandanUkrainianUruguayanUteVenezuelanVietnameseWelshWest IndianYakamaYaquiYugoslavianYumanYup'ikZimbabwean
Immigration
NonimmigrantsImmigrantsAfghanistanAfricaAlbaniaArgentinaArmeniaAsiaAustraliaAustriaBahamasBangladeshBarbadosBelarusBelgiumBelizeBoliviaBosnia and HerzegovinaBrazilBulgariaBurma/MyanmarCabo VerdeCambodiaCameroonCanadaCaribbeanCentral AmericaChileChinaColombiaCongoCosta RicaCroatiaCubaCzechoslovakiaDenmarkDominicaDominican RepublicEastern AfricaEastern AsiaEastern EuropeEcuadorEgyptEl SalvadorEnglandEritreaEthiopiaEuropeFijiFranceGermanyGhanaGreeceGrenadaGuatemalaGuyanaHaitiHondurasHong KongHungaryIndiaIndonesiaIranIraqIrelandIsraelItalyJamaicaJapanJordanKazakhstanKenyaKoreaKuwaitLaosLatin AmericaLatviaLebanonLiberiaLithuaniaMalaysiaMexicoMicronesiaMiddle AfricaMoldovaMoroccoNepalNetherlandsNicaraguaNigeriaNorth AmericaNorth MacedoniaNorthern AfricaNorthern EuropeNorwayOceaniaPakistanPanamaPeruPhilippinesPolandPortugalRomaniaRussiaSaudi ArabiaScotlandSenegalSerbiaSierra LeoneSomaliaSouth AfricaSouth AmericaSouth Central AsiaSouth Eastern AsiaSouthern EuropeSpainSri LankaSt. Vincent and the GrenadinesSudanSwedenSwitzerlandSyriaTaiwanThailandTrinidad and TobagoTurkeyUgandaUkraineUruguayUzbekistanVenezuelaVietnamWest IndiesWestern AfricaWestern AsiaWestern EuropeYemenZaireZimbabweAzores
Immigrants from Singapore
Race
Ancestry
AfghanAfricanAlaska NativeAlaskan AthabascanAlbanianAleutAlsatianAmericanApacheArabArapahoArgentineanArmenianAssyrian/Chaldean/SyriacAustralianAustrianBahamianBangladeshiBarbadianBasqueBelgianBelizeanBermudanBhutaneseBlackfeetBolivianBrazilianBritishBritish West IndianBulgarianBurmeseCajunCambodianCanadianCape VerdeanCelticCentral AmericanCentral American IndianCherokeeCheyenneChickasawChileanChineseChippewaChoctawColombianColvilleComancheCosta RicanCreeCreekCroatianCrowCubanCypriotCzechCzechoslovakianDanishDelawareDominicanDutchDutch West IndianEastern EuropeanEcuadorianEgyptianEnglishEstonianEthiopianEuropeanFijianFilipinoFinnishFrenchFrench American IndianFrench CanadianGermanGerman RussianGhanaianGreekGuamanian/ChamorroGuatemalanGuyaneseHaitianHmongHonduranHopiHoumaHungarianIcelanderIndian (Asian)IndonesianInupiatIranianIraqiIrishIroquoisIsraeliItalianJamaicanJapaneseJordanianKenyanKiowaKoreanLaotianLatvianLebaneseLiberianLithuanianLumbeeLuxembourgerMacedonianMalaysianMalteseMarshalleseMenomineeMexicanMexican American IndianMongolianMoroccanNative HawaiianNavajoNepaleseNew ZealanderNicaraguanNigerianNorthern EuropeanNorwegianOkinawanOsageOttawaPaiutePakistaniPalestinianPanamanianParaguayanPennsylvania GermanPeruvianPimaPolishPortuguesePotawatomiPuebloPuerto RicanPuget Sound SalishRomanianRussianSalvadoranSamoanScandinavianScotch-IrishScottishSeminoleSenegaleseSerbianShoshoneSierra LeoneanSiouxSlavicSlovakSloveneSomaliSouth AfricanSouth AmericanSouth American IndianSoviet UnionSpaniardSpanishSpanish AmericanSpanish American IndianSri LankanSubsaharan AfricanSudaneseSwedishSwissSyrianTaiwaneseThaiTlingit-HaidaTohono O'OdhamTonganTrinidadian and TobagonianTsimshianTurkishU.S. Virgin IslanderUgandanUkrainianUruguayanUteVenezuelanVietnameseWelshWest IndianYakamaYaquiYugoslavianYumanYup'ikZimbabwean
Immigration
NonimmigrantsImmigrantsAfghanistanAfricaAlbaniaArgentinaArmeniaAsiaAustraliaAustriaBahamasBangladeshBarbadosBelarusBelgiumBelizeBoliviaBosnia and HerzegovinaBrazilBulgariaBurma/MyanmarCabo VerdeCambodiaCameroonCanadaCaribbeanCentral AmericaChileChinaColombiaCongoCosta RicaCroatiaCubaCzechoslovakiaDenmarkDominicaDominican RepublicEastern AfricaEastern AsiaEastern EuropeEcuadorEgyptEl SalvadorEnglandEritreaEthiopiaEuropeFijiFranceGermanyGhanaGreeceGrenadaGuatemalaGuyanaHaitiHondurasHong KongHungaryIndiaIndonesiaIranIraqIrelandIsraelItalyJamaicaJapanJordanKazakhstanKenyaKoreaKuwaitLaosLatin AmericaLatviaLebanonLiberiaLithuaniaMalaysiaMexicoMicronesiaMiddle AfricaMoldovaMoroccoNepalNetherlandsNicaraguaNigeriaNorth AmericaNorth MacedoniaNorthern AfricaNorthern EuropeNorwayOceaniaPakistanPanamaPeruPhilippinesPolandPortugalRomaniaRussiaSaudi ArabiaScotlandSenegalSerbiaSierra LeoneSingaporeSomaliaSouth AfricaSouth AmericaSouth Central AsiaSouth Eastern AsiaSouthern EuropeSpainSri LankaSt. Vincent and the GrenadinesSudanSwedenSwitzerlandSyriaTaiwanThailandTrinidad and TobagoTurkeyUgandaUkraineUruguayUzbekistanVenezuelaVietnamWest IndiesWestern AfricaWestern AsiaWestern EuropeYemenZaireZimbabweAzores
Married-Couple Family Poverty
Income
Poverty
Unemployment
Labor Participation
Family Structure
Vehicle Availability
Education Level
Disability

Married-Couple Family Poverty Comparison

Carpatho Rusyns

Immigrants from Singapore

Exceptional
Exceptional
3.9%
MARRIED-COUPLE FAMILY POVERTY
100.0/ 100
METRIC RATING
10th/ 347
METRIC RANK
4.1%
MARRIED-COUPLE FAMILY POVERTY
99.9/ 100
METRIC RATING
22nd/ 347
METRIC RANK

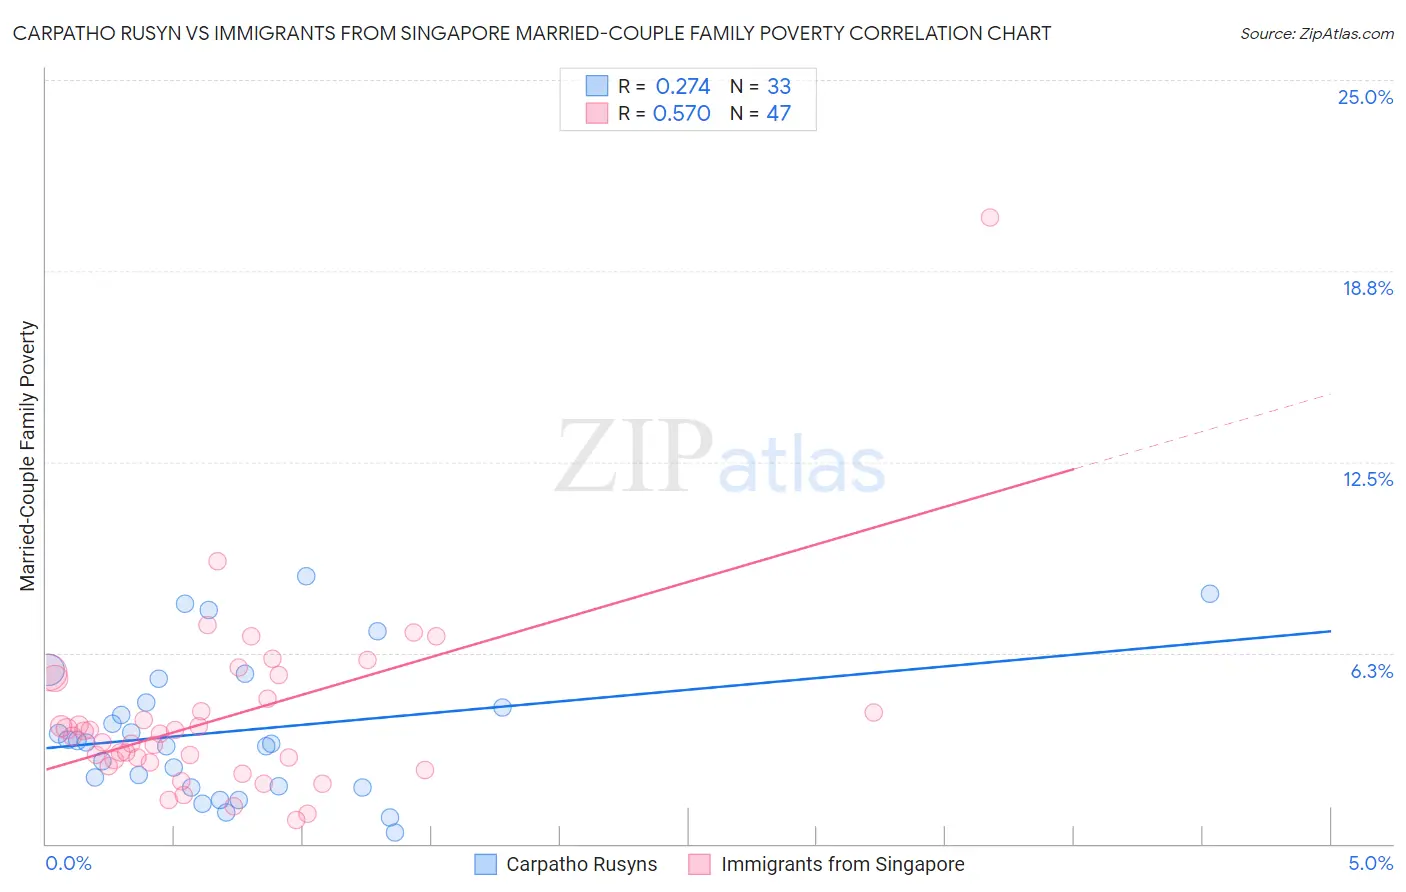
Carpatho Rusyn vs Immigrants from Singapore Married-Couple Family Poverty Correlation Chart

The statistical analysis conducted on geographies consisting of 58,607,667 people shows a weak positive correlation between the proportion of Carpatho Rusyns and poverty level among married-couple families in the United States with a correlation coefficient (R) of 0.274 and weighted average of 3.9%. Similarly, the statistical analysis conducted on geographies consisting of 136,997,668 people shows a substantial positive correlation between the proportion of Immigrants from Singapore and poverty level among married-couple families in the United States with a correlation coefficient (R) of 0.570 and weighted average of 4.1%, a difference of 4.0%.
Carpatho Rusyn vs Immigrants from Singapore Married-Couple Family Poverty

Married-Couple Family Poverty Correlation Summary

MeasurementCarpatho RusynImmigrants from Singapore
Minimum0.39%0.78%
Maximum8.8%20.5%
Range8.4%19.7%
Mean3.7%4.1%
Median3.3%3.6%
Interquartile 25% (IQ1)1.9%2.6%
Interquartile 75% (IQ3)5.0%5.4%
Interquartile Range (IQR)3.2%2.8%
Standard Deviation (Sample)2.2%3.0%
Standard Deviation (Population)2.2%3.0%

Demographics Similar to Carpatho Rusyns and Immigrants from Singapore by Married-Couple Family Poverty

In terms of married-couple family poverty, the demographic groups most similar to Carpatho Rusyns are Croatian (3.9%, a difference of 0.050%), Thai (3.9%, a difference of 0.49%), Lithuanian (4.0%, a difference of 0.51%), Latvian (3.9%, a difference of 1.0%), and Bulgarian (4.0%, a difference of 1.2%). Similarly, the demographic groups most similar to Immigrants from Singapore are Bhutanese (4.1%, a difference of 0.020%), Eastern European (4.1%, a difference of 0.26%), Zimbabwean (4.1%, a difference of 0.37%), Maltese (4.1%, a difference of 0.40%), and Immigrants from Ireland (4.1%, a difference of 0.64%).
DemographicsRating | RankMarried-Couple Family Poverty
Luxembourgers
100.0
/100
|
#6
Exceptional
3.9%
Latvians
100.0
/100
|
#7
Exceptional
3.9%
Thais
100.0
/100
|
#8
Exceptional
3.9%
Croatians
100.0
/100
|
#9
Exceptional
3.9%
Carpatho Rusyns
100.0
/100
|
#10
Exceptional
3.9%
Lithuanians
100.0
/100
|
#11
Exceptional
4.0%
Bulgarians
100.0
/100
|
#12
Exceptional
4.0%
Czechs
100.0
/100
|
#13
Exceptional
4.0%
Slovaks
100.0
/100
|
#14
Exceptional
4.0%
Poles
100.0
/100
|
#15
Exceptional
4.0%
Germans
100.0
/100
|
#16
Exceptional
4.0%
Filipinos
100.0
/100
|
#17
Exceptional
4.0%
Italians
100.0
/100
|
#18
Exceptional
4.0%
Immigrants | Ireland
99.9
/100
|
#19
Exceptional
4.1%
Maltese
99.9
/100
|
#20
Exceptional
4.1%
Zimbabweans
99.9
/100
|
#21
Exceptional
4.1%
Immigrants | Singapore
99.9
/100
|
#22
Exceptional
4.1%
Bhutanese
99.9
/100
|
#23
Exceptional
4.1%
Eastern Europeans
99.9
/100
|
#24
Exceptional
4.1%
Immigrants | Taiwan
99.9
/100
|
#25
Exceptional
4.1%
Cypriots
99.9
/100
|
#26
Exceptional
4.1%