Mongolian vs Immigrants from Senegal Married-Couple Family Poverty
COMPARE
Mongolian
Immigrants from Senegal
Married-Couple Family Poverty
Married-Couple Family Poverty Comparison
Mongolians
Immigrants from Senegal
5.0%
MARRIED-COUPLE FAMILY POVERTY
79.8/ 100
METRIC RATING
146th/ 347
METRIC RANK
6.1%
MARRIED-COUPLE FAMILY POVERTY
0.3/ 100
METRIC RATING
263rd/ 347
METRIC RANK
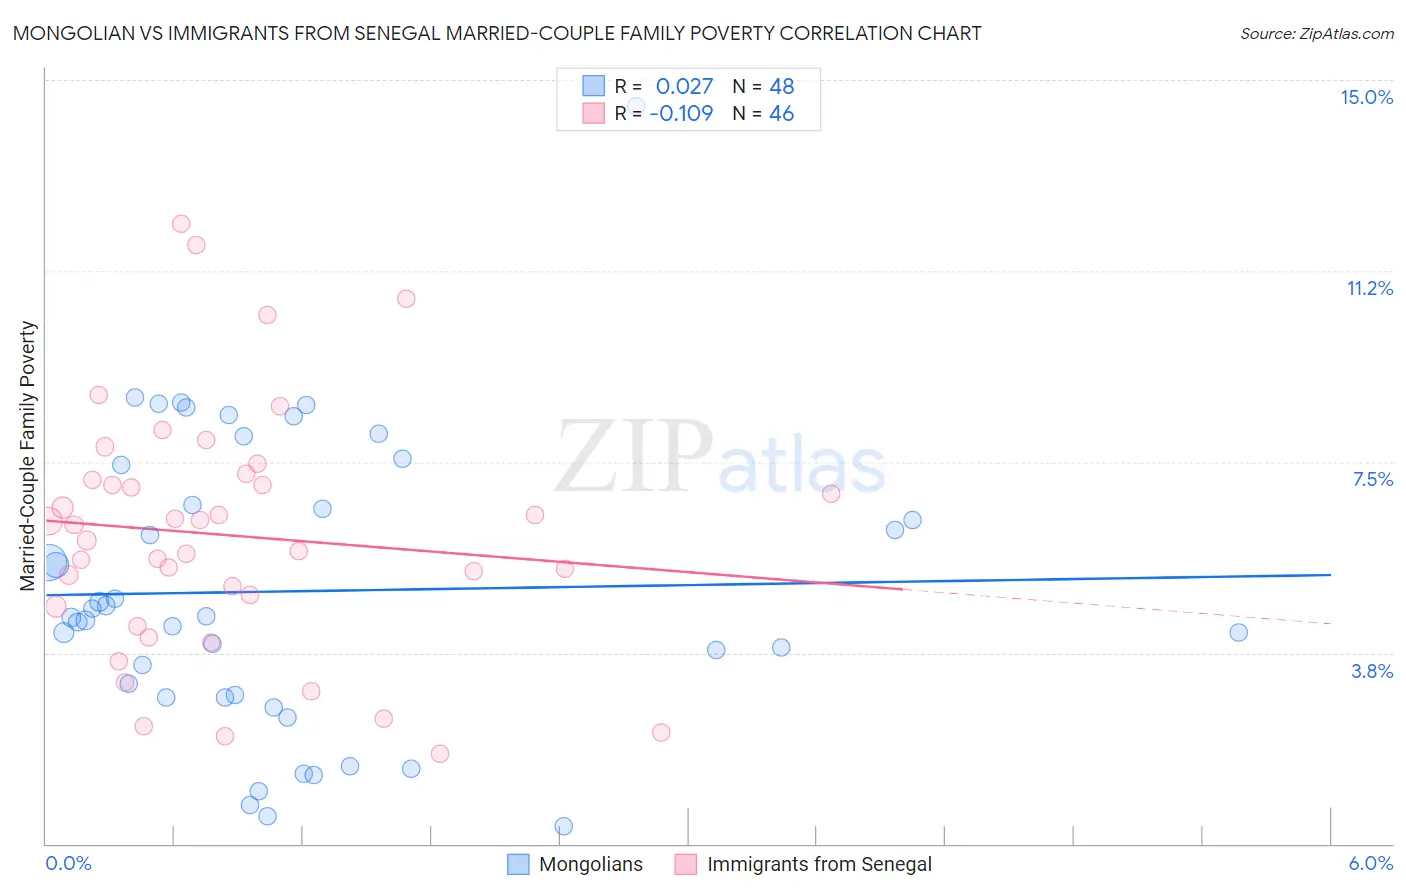
Mongolian vs Immigrants from Senegal Married-Couple Family Poverty Correlation Chart
The statistical analysis conducted on geographies consisting of 139,875,395 people shows no correlation between the proportion of Mongolians and poverty level among married-couple families in the United States with a correlation coefficient (R) of 0.027 and weighted average of 5.0%. Similarly, the statistical analysis conducted on geographies consisting of 89,915,851 people shows a poor negative correlation between the proportion of Immigrants from Senegal and poverty level among married-couple families in the United States with a correlation coefficient (R) of -0.109 and weighted average of 6.1%, a difference of 22.3%.
Married-Couple Family Poverty Correlation Summary
| Measurement | Mongolian | Immigrants from Senegal |
| Minimum | 0.35% | 1.8% |
| Maximum | 14.5% | 12.2% |
| Range | 14.1% | 10.4% |
| Mean | 5.0% | 6.1% |
| Median | 4.5% | 6.1% |
| Interquartile 25% (IQ1) | 2.9% | 4.7% |
| Interquartile 75% (IQ3) | 7.1% | 7.1% |
| Interquartile Range (IQR) | 4.1% | 2.5% |
| Standard Deviation (Sample) | 2.9% | 2.4% |
| Standard Deviation (Population) | 2.8% | 2.4% |
Similar Demographics by Married-Couple Family Poverty
Demographics Similar to Mongolians by Married-Couple Family Poverty
In terms of married-couple family poverty, the demographic groups most similar to Mongolians are Immigrants from Spain (5.0%, a difference of 0.020%), Syrian (5.0%, a difference of 0.19%), Immigrants from Russia (5.0%, a difference of 0.20%), Immigrants from Oceania (5.0%, a difference of 0.22%), and Brazilian (5.0%, a difference of 0.27%).
| Demographics | Rating | Rank | Married-Couple Family Poverty |
| German Russians | 85.1 /100 | #139 | Excellent 5.0% |
| Immigrants | Portugal | 84.8 /100 | #140 | Excellent 5.0% |
| Immigrants | Brazil | 84.6 /100 | #141 | Excellent 5.0% |
| Immigrants | China | 84.6 /100 | #142 | Excellent 5.0% |
| Immigrants | Egypt | 83.4 /100 | #143 | Excellent 5.0% |
| Hmong | 83.2 /100 | #144 | Excellent 5.0% |
| Immigrants | Spain | 79.9 /100 | #145 | Good 5.0% |
| Mongolians | 79.8 /100 | #146 | Good 5.0% |
| Syrians | 78.7 /100 | #147 | Good 5.0% |
| Immigrants | Russia | 78.7 /100 | #148 | Good 5.0% |
| Immigrants | Oceania | 78.6 /100 | #149 | Good 5.0% |
| Brazilians | 78.3 /100 | #150 | Good 5.0% |
| Immigrants | Cameroon | 77.3 /100 | #151 | Good 5.0% |
| Albanians | 77.2 /100 | #152 | Good 5.0% |
| Immigrants | Kuwait | 76.3 /100 | #153 | Good 5.0% |
Demographics Similar to Immigrants from Senegal by Married-Couple Family Poverty
In terms of married-couple family poverty, the demographic groups most similar to Immigrants from Senegal are Immigrants from Congo (6.1%, a difference of 0.22%), Shoshone (6.1%, a difference of 0.39%), Senegalese (6.1%, a difference of 0.60%), Blackfeet (6.2%, a difference of 0.66%), and Creek (6.2%, a difference of 0.73%).
| Demographics | Rating | Rank | Married-Couple Family Poverty |
| Bangladeshis | 0.5 /100 | #256 | Tragic 6.0% |
| Immigrants | Burma/Myanmar | 0.5 /100 | #257 | Tragic 6.0% |
| Immigrants | Immigrants | 0.5 /100 | #258 | Tragic 6.0% |
| Alaskan Athabascans | 0.4 /100 | #259 | Tragic 6.1% |
| Jamaicans | 0.3 /100 | #260 | Tragic 6.1% |
| Senegalese | 0.3 /100 | #261 | Tragic 6.1% |
| Shoshone | 0.3 /100 | #262 | Tragic 6.1% |
| Immigrants | Senegal | 0.3 /100 | #263 | Tragic 6.1% |
| Immigrants | Congo | 0.2 /100 | #264 | Tragic 6.1% |
| Blackfeet | 0.2 /100 | #265 | Tragic 6.2% |
| Creek | 0.2 /100 | #266 | Tragic 6.2% |
| Spanish Americans | 0.2 /100 | #267 | Tragic 6.2% |
| Alaska Natives | 0.2 /100 | #268 | Tragic 6.2% |
| Immigrants | West Indies | 0.1 /100 | #269 | Tragic 6.2% |
| Immigrants | Jamaica | 0.1 /100 | #270 | Tragic 6.2% |