Luxembourger vs Immigrants from Singapore Married-Couple Family Poverty
COMPARE
Luxembourger
Immigrants from Singapore
Married-Couple Family Poverty
Married-Couple Family Poverty Comparison
Luxembourgers
Immigrants from Singapore
3.9%
MARRIED-COUPLE FAMILY POVERTY
100.0/ 100
METRIC RATING
6th/ 347
METRIC RANK
4.1%
MARRIED-COUPLE FAMILY POVERTY
99.9/ 100
METRIC RATING
22nd/ 347
METRIC RANK
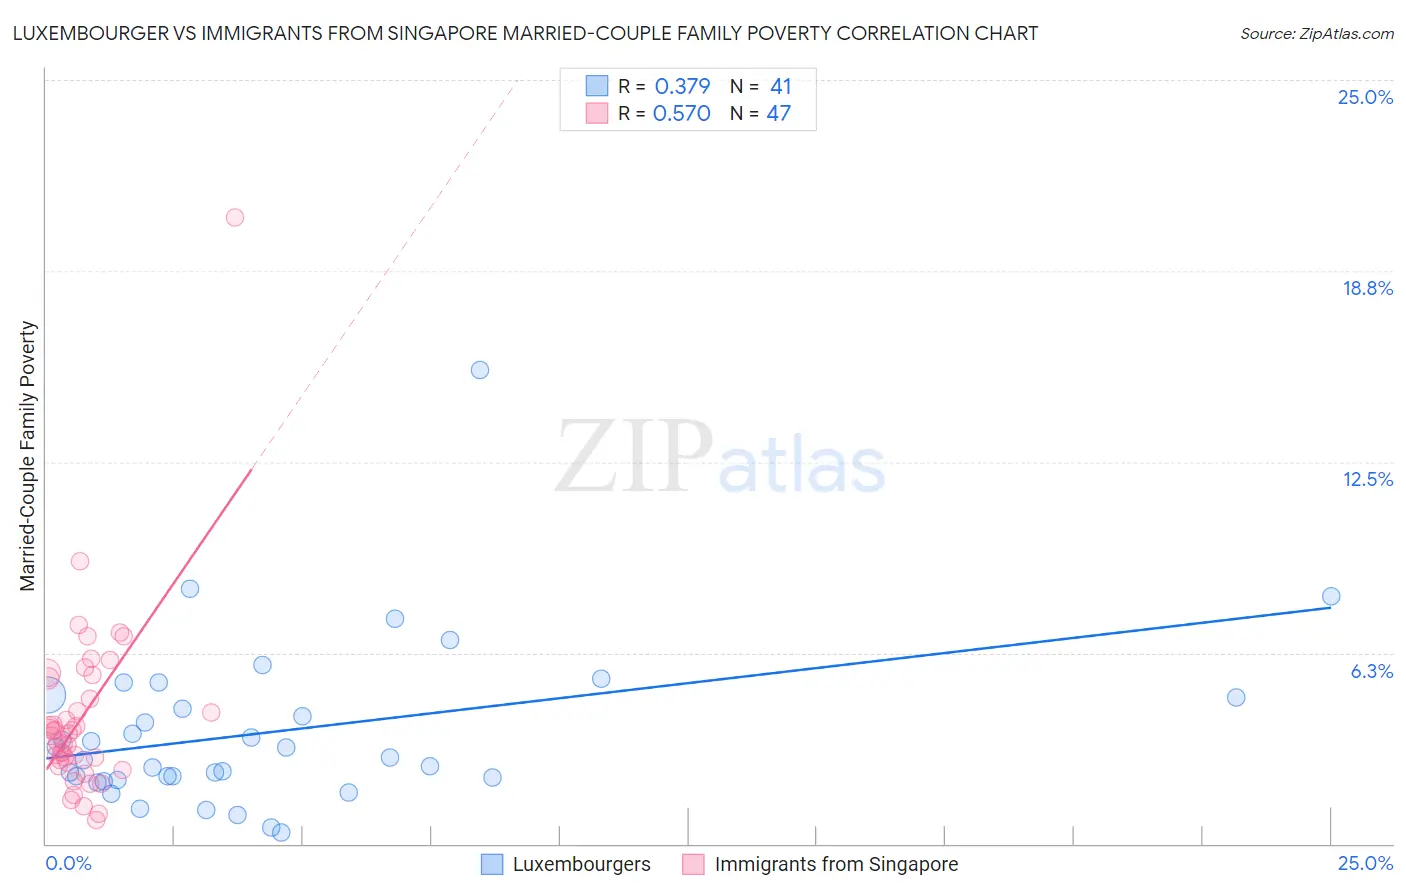
Luxembourger vs Immigrants from Singapore Married-Couple Family Poverty Correlation Chart
The statistical analysis conducted on geographies consisting of 143,792,583 people shows a mild positive correlation between the proportion of Luxembourgers and poverty level among married-couple families in the United States with a correlation coefficient (R) of 0.379 and weighted average of 3.9%. Similarly, the statistical analysis conducted on geographies consisting of 136,997,668 people shows a substantial positive correlation between the proportion of Immigrants from Singapore and poverty level among married-couple families in the United States with a correlation coefficient (R) of 0.570 and weighted average of 4.1%, a difference of 5.6%.
Married-Couple Family Poverty Correlation Summary
| Measurement | Luxembourger | Immigrants from Singapore |
| Minimum | 0.35% | 0.78% |
| Maximum | 15.5% | 20.5% |
| Range | 15.1% | 19.7% |
| Mean | 3.7% | 4.1% |
| Median | 2.8% | 3.6% |
| Interquartile 25% (IQ1) | 2.1% | 2.6% |
| Interquartile 75% (IQ3) | 4.8% | 5.4% |
| Interquartile Range (IQR) | 2.7% | 2.8% |
| Standard Deviation (Sample) | 2.7% | 3.0% |
| Standard Deviation (Population) | 2.7% | 3.0% |
Demographics Similar to Luxembourgers and Immigrants from Singapore by Married-Couple Family Poverty
In terms of married-couple family poverty, the demographic groups most similar to Luxembourgers are Latvian (3.9%, a difference of 0.52%), Swedish (3.9%, a difference of 0.61%), Slovene (3.8%, a difference of 0.76%), Thai (3.9%, a difference of 1.1%), and Croatian (3.9%, a difference of 1.5%). Similarly, the demographic groups most similar to Immigrants from Singapore are Bhutanese (4.1%, a difference of 0.020%), Eastern European (4.1%, a difference of 0.26%), Zimbabwean (4.1%, a difference of 0.37%), Maltese (4.1%, a difference of 0.40%), and Immigrants from Ireland (4.1%, a difference of 0.64%).
| Demographics | Rating | Rank | Married-Couple Family Poverty |
| Slovenes | 100.0 /100 | #4 | Exceptional 3.8% |
| Swedes | 100.0 /100 | #5 | Exceptional 3.9% |
| Luxembourgers | 100.0 /100 | #6 | Exceptional 3.9% |
| Latvians | 100.0 /100 | #7 | Exceptional 3.9% |
| Thais | 100.0 /100 | #8 | Exceptional 3.9% |
| Croatians | 100.0 /100 | #9 | Exceptional 3.9% |
| Carpatho Rusyns | 100.0 /100 | #10 | Exceptional 3.9% |
| Lithuanians | 100.0 /100 | #11 | Exceptional 4.0% |
| Bulgarians | 100.0 /100 | #12 | Exceptional 4.0% |
| Czechs | 100.0 /100 | #13 | Exceptional 4.0% |
| Slovaks | 100.0 /100 | #14 | Exceptional 4.0% |
| Poles | 100.0 /100 | #15 | Exceptional 4.0% |
| Germans | 100.0 /100 | #16 | Exceptional 4.0% |
| Filipinos | 100.0 /100 | #17 | Exceptional 4.0% |
| Italians | 100.0 /100 | #18 | Exceptional 4.0% |
| Immigrants | Ireland | 99.9 /100 | #19 | Exceptional 4.1% |
| Maltese | 99.9 /100 | #20 | Exceptional 4.1% |
| Zimbabweans | 99.9 /100 | #21 | Exceptional 4.1% |
| Immigrants | Singapore | 99.9 /100 | #22 | Exceptional 4.1% |
| Bhutanese | 99.9 /100 | #23 | Exceptional 4.1% |
| Eastern Europeans | 99.9 /100 | #24 | Exceptional 4.1% |