Inupiat vs Immigrants from Singapore Married-Couple Family Poverty
COMPARE
Inupiat
Immigrants from Singapore
Married-Couple Family Poverty
Married-Couple Family Poverty Comparison
Inupiat
Immigrants from Singapore
7.1%
MARRIED-COUPLE FAMILY POVERTY
0.0/ 100
METRIC RATING
315th/ 347
METRIC RANK
4.1%
MARRIED-COUPLE FAMILY POVERTY
99.9/ 100
METRIC RATING
22nd/ 347
METRIC RANK
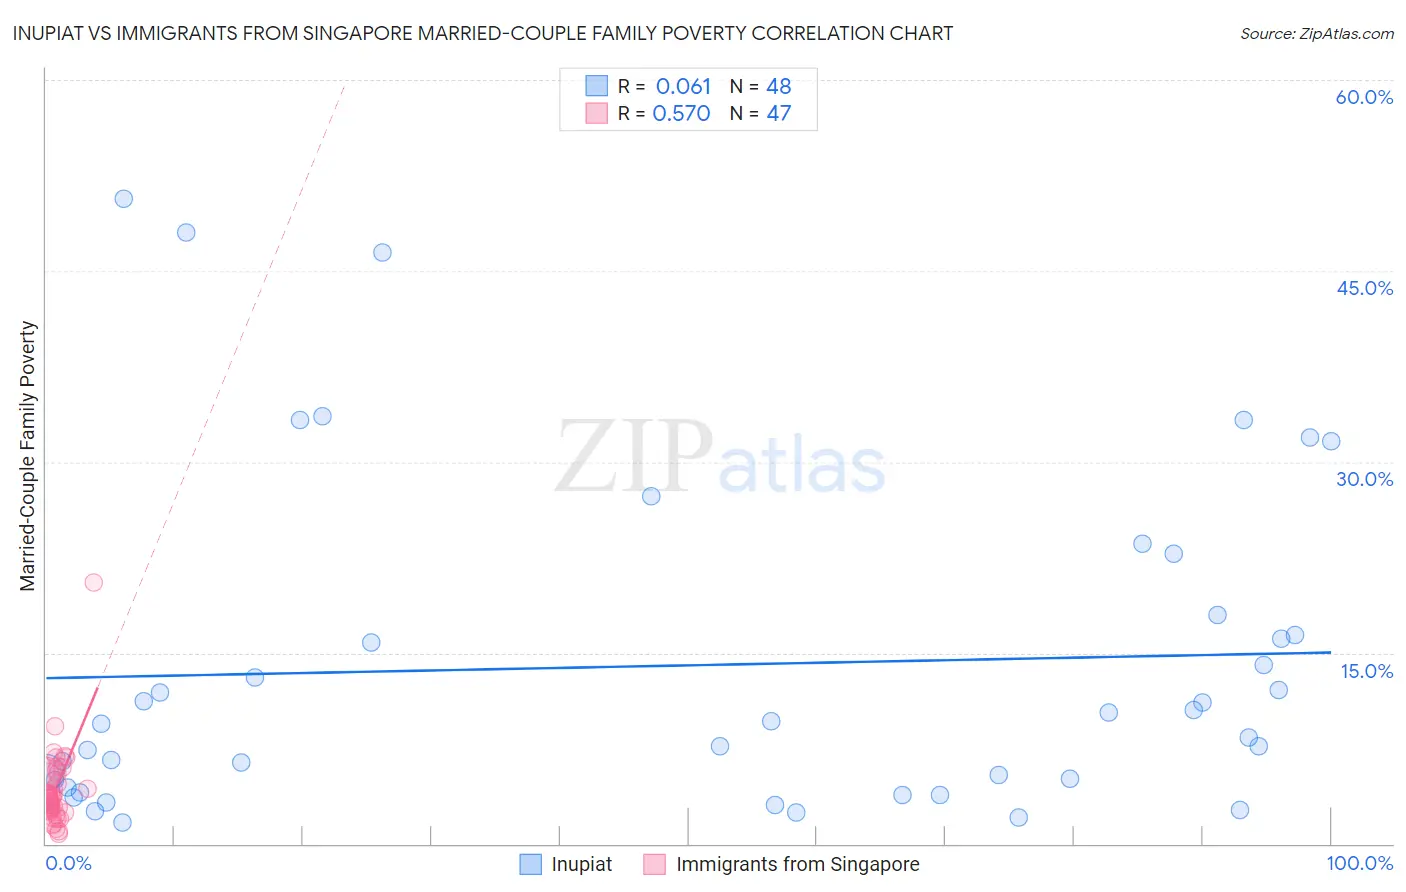
Inupiat vs Immigrants from Singapore Married-Couple Family Poverty Correlation Chart
The statistical analysis conducted on geographies consisting of 96,004,773 people shows a slight positive correlation between the proportion of Inupiat and poverty level among married-couple families in the United States with a correlation coefficient (R) of 0.061 and weighted average of 7.1%. Similarly, the statistical analysis conducted on geographies consisting of 136,997,668 people shows a substantial positive correlation between the proportion of Immigrants from Singapore and poverty level among married-couple families in the United States with a correlation coefficient (R) of 0.570 and weighted average of 4.1%, a difference of 74.5%.
Married-Couple Family Poverty Correlation Summary
| Measurement | Inupiat | Immigrants from Singapore |
| Minimum | 1.6% | 0.78% |
| Maximum | 50.7% | 20.5% |
| Range | 49.0% | 19.7% |
| Mean | 14.0% | 4.1% |
| Median | 9.6% | 3.6% |
| Interquartile 25% (IQ1) | 4.7% | 2.6% |
| Interquartile 75% (IQ3) | 17.2% | 5.4% |
| Interquartile Range (IQR) | 12.5% | 2.8% |
| Standard Deviation (Sample) | 12.9% | 3.0% |
| Standard Deviation (Population) | 12.8% | 3.0% |
Similar Demographics by Married-Couple Family Poverty
Demographics Similar to Inupiat by Married-Couple Family Poverty
In terms of married-couple family poverty, the demographic groups most similar to Inupiat are Honduran (7.2%, a difference of 0.15%), British West Indian (7.1%, a difference of 0.24%), Mexican (7.2%, a difference of 0.47%), Immigrants from St. Vincent and the Grenadines (7.1%, a difference of 0.54%), and Immigrants from Guatemala (7.2%, a difference of 0.63%).
| Demographics | Rating | Rank | Married-Couple Family Poverty |
| Spanish American Indians | 0.0 /100 | #308 | Tragic 7.1% |
| Hopi | 0.0 /100 | #309 | Tragic 7.1% |
| Immigrants | Nicaragua | 0.0 /100 | #310 | Tragic 7.1% |
| Immigrants | Dominica | 0.0 /100 | #311 | Tragic 7.1% |
| Immigrants | Armenia | 0.0 /100 | #312 | Tragic 7.1% |
| Immigrants | St. Vincent and the Grenadines | 0.0 /100 | #313 | Tragic 7.1% |
| British West Indians | 0.0 /100 | #314 | Tragic 7.1% |
| Inupiat | 0.0 /100 | #315 | Tragic 7.1% |
| Hondurans | 0.0 /100 | #316 | Tragic 7.2% |
| Mexicans | 0.0 /100 | #317 | Tragic 7.2% |
| Immigrants | Guatemala | 0.0 /100 | #318 | Tragic 7.2% |
| Immigrants | Latin America | 0.0 /100 | #319 | Tragic 7.2% |
| Immigrants | Grenada | 0.0 /100 | #320 | Tragic 7.3% |
| Immigrants | Caribbean | 0.0 /100 | #321 | Tragic 7.3% |
| Immigrants | Honduras | 0.0 /100 | #322 | Tragic 7.3% |
Demographics Similar to Immigrants from Singapore by Married-Couple Family Poverty
In terms of married-couple family poverty, the demographic groups most similar to Immigrants from Singapore are Bhutanese (4.1%, a difference of 0.020%), Eastern European (4.1%, a difference of 0.26%), Zimbabwean (4.1%, a difference of 0.37%), Maltese (4.1%, a difference of 0.40%), and Immigrants from Ireland (4.1%, a difference of 0.64%).
| Demographics | Rating | Rank | Married-Couple Family Poverty |
| Poles | 100.0 /100 | #15 | Exceptional 4.0% |
| Germans | 100.0 /100 | #16 | Exceptional 4.0% |
| Filipinos | 100.0 /100 | #17 | Exceptional 4.0% |
| Italians | 100.0 /100 | #18 | Exceptional 4.0% |
| Immigrants | Ireland | 99.9 /100 | #19 | Exceptional 4.1% |
| Maltese | 99.9 /100 | #20 | Exceptional 4.1% |
| Zimbabweans | 99.9 /100 | #21 | Exceptional 4.1% |
| Immigrants | Singapore | 99.9 /100 | #22 | Exceptional 4.1% |
| Bhutanese | 99.9 /100 | #23 | Exceptional 4.1% |
| Eastern Europeans | 99.9 /100 | #24 | Exceptional 4.1% |
| Immigrants | Taiwan | 99.9 /100 | #25 | Exceptional 4.1% |
| Cypriots | 99.9 /100 | #26 | Exceptional 4.1% |
| Danes | 99.9 /100 | #27 | Exceptional 4.1% |
| Scandinavians | 99.9 /100 | #28 | Exceptional 4.1% |
| Immigrants | Scotland | 99.9 /100 | #29 | Exceptional 4.2% |