Immigrants from North America vs Immigrants from Singapore Married-Couple Family Poverty
COMPARE
Immigrants from North America
Immigrants from Singapore
Married-Couple Family Poverty
Married-Couple Family Poverty Comparison
Immigrants from North America
Immigrants from Singapore
4.5%
MARRIED-COUPLE FAMILY POVERTY
99.3/ 100
METRIC RATING
71st/ 347
METRIC RANK
4.1%
MARRIED-COUPLE FAMILY POVERTY
99.9/ 100
METRIC RATING
22nd/ 347
METRIC RANK
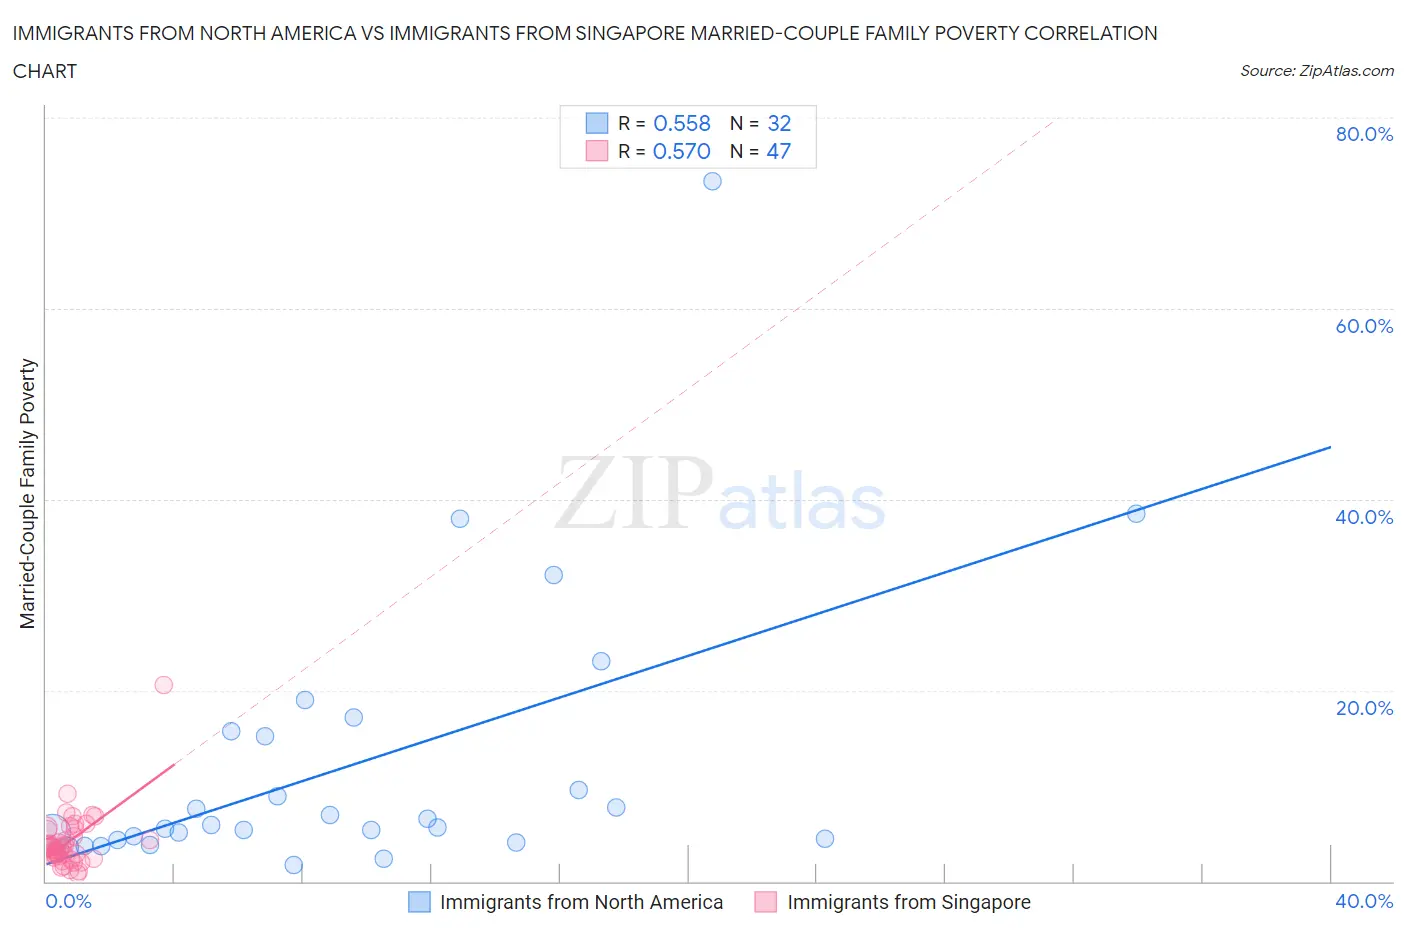
Immigrants from North America vs Immigrants from Singapore Married-Couple Family Poverty Correlation Chart
The statistical analysis conducted on geographies consisting of 456,163,835 people shows a substantial positive correlation between the proportion of Immigrants from North America and poverty level among married-couple families in the United States with a correlation coefficient (R) of 0.558 and weighted average of 4.5%. Similarly, the statistical analysis conducted on geographies consisting of 136,997,668 people shows a substantial positive correlation between the proportion of Immigrants from Singapore and poverty level among married-couple families in the United States with a correlation coefficient (R) of 0.570 and weighted average of 4.1%, a difference of 9.2%.
Married-Couple Family Poverty Correlation Summary
| Measurement | Immigrants from North America | Immigrants from Singapore |
| Minimum | 1.7% | 0.78% |
| Maximum | 73.3% | 20.5% |
| Range | 71.6% | 19.7% |
| Mean | 12.3% | 4.1% |
| Median | 5.7% | 3.6% |
| Interquartile 25% (IQ1) | 4.4% | 2.6% |
| Interquartile 75% (IQ3) | 15.5% | 5.4% |
| Interquartile Range (IQR) | 11.0% | 2.8% |
| Standard Deviation (Sample) | 14.9% | 3.0% |
| Standard Deviation (Population) | 14.7% | 3.0% |
Similar Demographics by Married-Couple Family Poverty
Demographics Similar to Immigrants from North America by Married-Couple Family Poverty
In terms of married-couple family poverty, the demographic groups most similar to Immigrants from North America are Immigrants from England (4.5%, a difference of 0.090%), Ukrainian (4.5%, a difference of 0.22%), Immigrants from Austria (4.5%, a difference of 0.32%), Immigrants from Korea (4.5%, a difference of 0.42%), and New Zealander (4.4%, a difference of 0.55%).
| Demographics | Rating | Rank | Married-Couple Family Poverty |
| Immigrants | Bulgaria | 99.5 /100 | #64 | Exceptional 4.4% |
| Macedonians | 99.4 /100 | #65 | Exceptional 4.4% |
| Immigrants | Serbia | 99.4 /100 | #66 | Exceptional 4.4% |
| Immigrants | Canada | 99.4 /100 | #67 | Exceptional 4.4% |
| Slavs | 99.4 /100 | #68 | Exceptional 4.4% |
| New Zealanders | 99.4 /100 | #69 | Exceptional 4.4% |
| Immigrants | Korea | 99.4 /100 | #70 | Exceptional 4.5% |
| Immigrants | North America | 99.3 /100 | #71 | Exceptional 4.5% |
| Immigrants | England | 99.3 /100 | #72 | Exceptional 4.5% |
| Ukrainians | 99.2 /100 | #73 | Exceptional 4.5% |
| Immigrants | Austria | 99.2 /100 | #74 | Exceptional 4.5% |
| Cambodians | 99.2 /100 | #75 | Exceptional 4.5% |
| Immigrants | South Africa | 99.1 /100 | #76 | Exceptional 4.5% |
| Immigrants | Latvia | 99.1 /100 | #77 | Exceptional 4.5% |
| Scotch-Irish | 99.1 /100 | #78 | Exceptional 4.5% |
Demographics Similar to Immigrants from Singapore by Married-Couple Family Poverty
In terms of married-couple family poverty, the demographic groups most similar to Immigrants from Singapore are Bhutanese (4.1%, a difference of 0.020%), Eastern European (4.1%, a difference of 0.26%), Zimbabwean (4.1%, a difference of 0.37%), Maltese (4.1%, a difference of 0.40%), and Immigrants from Ireland (4.1%, a difference of 0.64%).
| Demographics | Rating | Rank | Married-Couple Family Poverty |
| Poles | 100.0 /100 | #15 | Exceptional 4.0% |
| Germans | 100.0 /100 | #16 | Exceptional 4.0% |
| Filipinos | 100.0 /100 | #17 | Exceptional 4.0% |
| Italians | 100.0 /100 | #18 | Exceptional 4.0% |
| Immigrants | Ireland | 99.9 /100 | #19 | Exceptional 4.1% |
| Maltese | 99.9 /100 | #20 | Exceptional 4.1% |
| Zimbabweans | 99.9 /100 | #21 | Exceptional 4.1% |
| Immigrants | Singapore | 99.9 /100 | #22 | Exceptional 4.1% |
| Bhutanese | 99.9 /100 | #23 | Exceptional 4.1% |
| Eastern Europeans | 99.9 /100 | #24 | Exceptional 4.1% |
| Immigrants | Taiwan | 99.9 /100 | #25 | Exceptional 4.1% |
| Cypriots | 99.9 /100 | #26 | Exceptional 4.1% |
| Danes | 99.9 /100 | #27 | Exceptional 4.1% |
| Scandinavians | 99.9 /100 | #28 | Exceptional 4.1% |
| Immigrants | Scotland | 99.9 /100 | #29 | Exceptional 4.2% |