Mongolian vs Alaska Native Married-Couple Family Poverty
COMPARE
Mongolian
Alaska Native
Married-Couple Family Poverty
Married-Couple Family Poverty Comparison
Mongolians
Alaska Natives
5.0%
MARRIED-COUPLE FAMILY POVERTY
79.8/ 100
METRIC RATING
146th/ 347
METRIC RANK
6.2%
MARRIED-COUPLE FAMILY POVERTY
0.2/ 100
METRIC RATING
268th/ 347
METRIC RANK
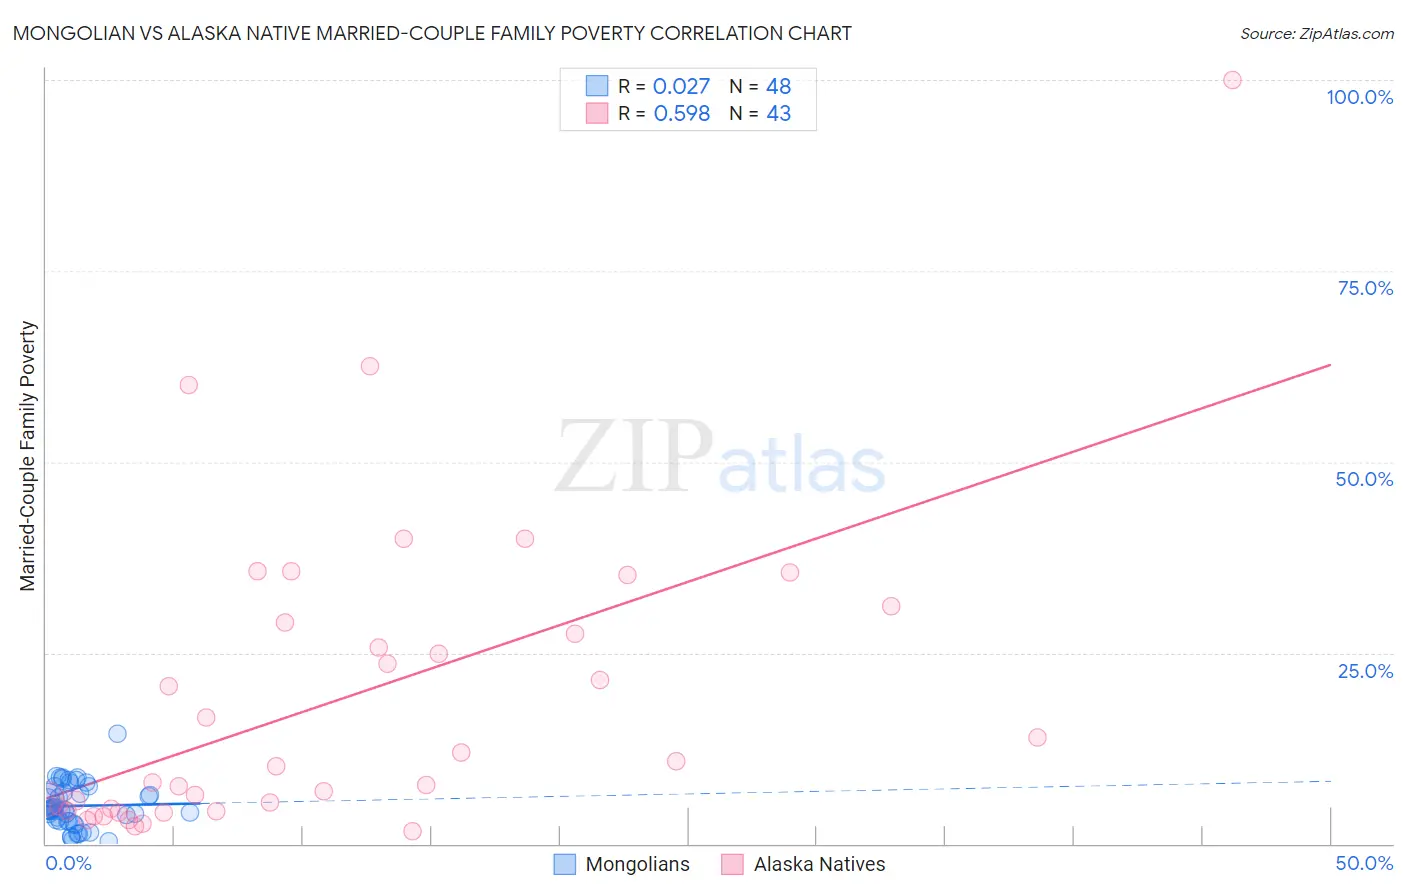
Mongolian vs Alaska Native Married-Couple Family Poverty Correlation Chart
The statistical analysis conducted on geographies consisting of 139,875,395 people shows no correlation between the proportion of Mongolians and poverty level among married-couple families in the United States with a correlation coefficient (R) of 0.027 and weighted average of 5.0%. Similarly, the statistical analysis conducted on geographies consisting of 76,597,225 people shows a substantial positive correlation between the proportion of Alaska Natives and poverty level among married-couple families in the United States with a correlation coefficient (R) of 0.598 and weighted average of 6.2%, a difference of 23.8%.
Married-Couple Family Poverty Correlation Summary
| Measurement | Mongolian | Alaska Native |
| Minimum | 0.35% | 1.6% |
| Maximum | 14.5% | 100.0% |
| Range | 14.1% | 98.4% |
| Mean | 5.0% | 18.9% |
| Median | 4.5% | 10.2% |
| Interquartile 25% (IQ1) | 2.9% | 4.3% |
| Interquartile 75% (IQ3) | 7.1% | 28.9% |
| Interquartile Range (IQR) | 4.1% | 24.6% |
| Standard Deviation (Sample) | 2.9% | 20.2% |
| Standard Deviation (Population) | 2.8% | 19.9% |
Similar Demographics by Married-Couple Family Poverty
Demographics Similar to Mongolians by Married-Couple Family Poverty
In terms of married-couple family poverty, the demographic groups most similar to Mongolians are Immigrants from Spain (5.0%, a difference of 0.020%), Syrian (5.0%, a difference of 0.19%), Immigrants from Russia (5.0%, a difference of 0.20%), Immigrants from Oceania (5.0%, a difference of 0.22%), and Brazilian (5.0%, a difference of 0.27%).
| Demographics | Rating | Rank | Married-Couple Family Poverty |
| German Russians | 85.1 /100 | #139 | Excellent 5.0% |
| Immigrants | Portugal | 84.8 /100 | #140 | Excellent 5.0% |
| Immigrants | Brazil | 84.6 /100 | #141 | Excellent 5.0% |
| Immigrants | China | 84.6 /100 | #142 | Excellent 5.0% |
| Immigrants | Egypt | 83.4 /100 | #143 | Excellent 5.0% |
| Hmong | 83.2 /100 | #144 | Excellent 5.0% |
| Immigrants | Spain | 79.9 /100 | #145 | Good 5.0% |
| Mongolians | 79.8 /100 | #146 | Good 5.0% |
| Syrians | 78.7 /100 | #147 | Good 5.0% |
| Immigrants | Russia | 78.7 /100 | #148 | Good 5.0% |
| Immigrants | Oceania | 78.6 /100 | #149 | Good 5.0% |
| Brazilians | 78.3 /100 | #150 | Good 5.0% |
| Immigrants | Cameroon | 77.3 /100 | #151 | Good 5.0% |
| Albanians | 77.2 /100 | #152 | Good 5.0% |
| Immigrants | Kuwait | 76.3 /100 | #153 | Good 5.0% |
Demographics Similar to Alaska Natives by Married-Couple Family Poverty
In terms of married-couple family poverty, the demographic groups most similar to Alaska Natives are Immigrants from West Indies (6.2%, a difference of 0.17%), Immigrants from Jamaica (6.2%, a difference of 0.21%), Immigrants from Bahamas (6.2%, a difference of 0.43%), Trinidadian and Tobagonian (6.2%, a difference of 0.46%), and Spanish American (6.2%, a difference of 0.48%).
| Demographics | Rating | Rank | Married-Couple Family Poverty |
| Senegalese | 0.3 /100 | #261 | Tragic 6.1% |
| Shoshone | 0.3 /100 | #262 | Tragic 6.1% |
| Immigrants | Senegal | 0.3 /100 | #263 | Tragic 6.1% |
| Immigrants | Congo | 0.2 /100 | #264 | Tragic 6.1% |
| Blackfeet | 0.2 /100 | #265 | Tragic 6.2% |
| Creek | 0.2 /100 | #266 | Tragic 6.2% |
| Spanish Americans | 0.2 /100 | #267 | Tragic 6.2% |
| Alaska Natives | 0.2 /100 | #268 | Tragic 6.2% |
| Immigrants | West Indies | 0.1 /100 | #269 | Tragic 6.2% |
| Immigrants | Jamaica | 0.1 /100 | #270 | Tragic 6.2% |
| Immigrants | Bahamas | 0.1 /100 | #271 | Tragic 6.2% |
| Trinidadians and Tobagonians | 0.1 /100 | #272 | Tragic 6.2% |
| Colville | 0.1 /100 | #273 | Tragic 6.3% |
| Barbadians | 0.1 /100 | #274 | Tragic 6.3% |
| Choctaw | 0.1 /100 | #275 | Tragic 6.3% |