Mongolian vs Immigrants from Belize Child Poverty Among Boys Under 16
COMPARE
Mongolian
Immigrants from Belize
Child Poverty Among Boys Under 16
Child Poverty Among Boys Under 16 Comparison
Mongolians
Immigrants from Belize
15.4%
CHILD POVERTY AMONG BOYS UNDER 16
90.2/ 100
METRIC RATING
130th/ 347
METRIC RANK
20.3%
CHILD POVERTY AMONG BOYS UNDER 16
0.0/ 100
METRIC RATING
287th/ 347
METRIC RANK
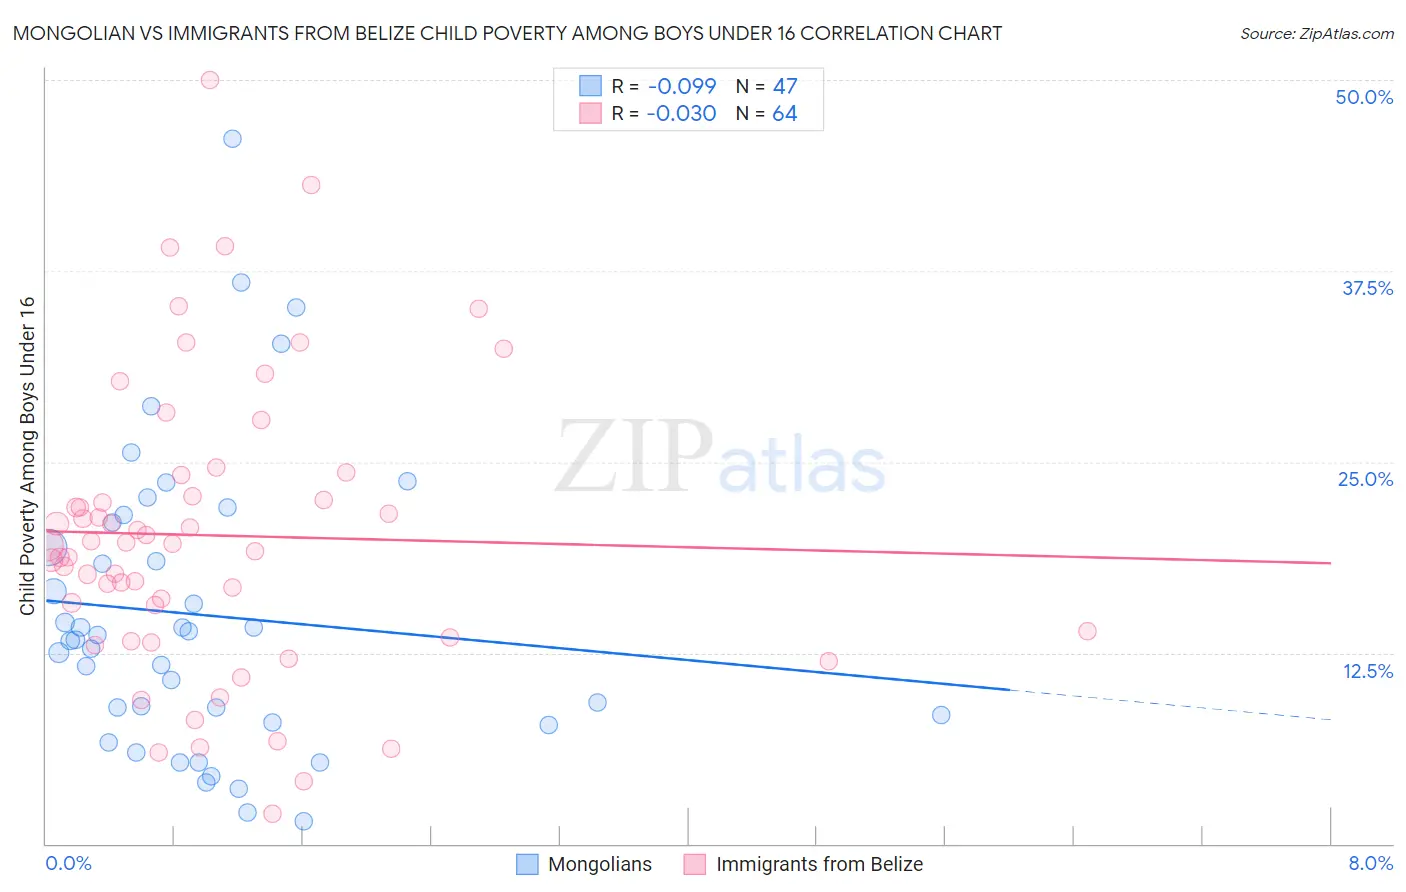
Mongolian vs Immigrants from Belize Child Poverty Among Boys Under 16 Correlation Chart
The statistical analysis conducted on geographies consisting of 139,635,947 people shows a slight negative correlation between the proportion of Mongolians and poverty level among boys under the age of 16 in the United States with a correlation coefficient (R) of -0.099 and weighted average of 15.4%. Similarly, the statistical analysis conducted on geographies consisting of 129,792,117 people shows no correlation between the proportion of Immigrants from Belize and poverty level among boys under the age of 16 in the United States with a correlation coefficient (R) of -0.030 and weighted average of 20.3%, a difference of 31.4%.
Child Poverty Among Boys Under 16 Correlation Summary
| Measurement | Mongolian | Immigrants from Belize |
| Minimum | 1.5% | 2.0% |
| Maximum | 46.2% | 50.0% |
| Range | 44.7% | 48.0% |
| Mean | 15.0% | 20.2% |
| Median | 13.4% | 19.6% |
| Interquartile 25% (IQ1) | 7.9% | 13.7% |
| Interquartile 75% (IQ3) | 21.0% | 23.4% |
| Interquartile Range (IQR) | 13.1% | 9.7% |
| Standard Deviation (Sample) | 9.7% | 9.6% |
| Standard Deviation (Population) | 9.6% | 9.5% |
Similar Demographics by Child Poverty Among Boys Under 16
Demographics Similar to Mongolians by Child Poverty Among Boys Under 16
In terms of child poverty among boys under 16, the demographic groups most similar to Mongolians are Immigrants from Brazil (15.4%, a difference of 0.020%), Immigrants from Western Europe (15.4%, a difference of 0.060%), Canadian (15.4%, a difference of 0.14%), Carpatho Rusyn (15.4%, a difference of 0.33%), and Palestinian (15.4%, a difference of 0.38%).
| Demographics | Rating | Rank | Child Poverty Among Boys Under 16 |
| Immigrants | Norway | 92.3 /100 | #123 | Exceptional 15.3% |
| Tlingit-Haida | 92.2 /100 | #124 | Exceptional 15.3% |
| Czechoslovakians | 92.1 /100 | #125 | Exceptional 15.3% |
| Palestinians | 91.3 /100 | #126 | Exceptional 15.4% |
| Carpatho Rusyns | 91.1 /100 | #127 | Exceptional 15.4% |
| Canadians | 90.6 /100 | #128 | Exceptional 15.4% |
| Immigrants | Brazil | 90.3 /100 | #129 | Exceptional 15.4% |
| Mongolians | 90.2 /100 | #130 | Exceptional 15.4% |
| Immigrants | Western Europe | 90.0 /100 | #131 | Exceptional 15.4% |
| Immigrants | Kazakhstan | 88.7 /100 | #132 | Excellent 15.5% |
| Welsh | 88.3 /100 | #133 | Excellent 15.5% |
| Peruvians | 88.1 /100 | #134 | Excellent 15.5% |
| Portuguese | 87.5 /100 | #135 | Excellent 15.5% |
| Icelanders | 87.5 /100 | #136 | Excellent 15.5% |
| Immigrants | Spain | 87.1 /100 | #137 | Excellent 15.6% |
Demographics Similar to Immigrants from Belize by Child Poverty Among Boys Under 16
In terms of child poverty among boys under 16, the demographic groups most similar to Immigrants from Belize are West Indian (20.3%, a difference of 0.060%), Immigrants from St. Vincent and the Grenadines (20.3%, a difference of 0.27%), Arapaho (20.2%, a difference of 0.40%), Blackfeet (20.4%, a difference of 0.52%), and Barbadian (20.2%, a difference of 0.55%).
| Demographics | Rating | Rank | Child Poverty Among Boys Under 16 |
| Central Americans | 0.0 /100 | #280 | Tragic 20.1% |
| Immigrants | Zaire | 0.0 /100 | #281 | Tragic 20.1% |
| Comanche | 0.0 /100 | #282 | Tragic 20.1% |
| Immigrants | Jamaica | 0.0 /100 | #283 | Tragic 20.1% |
| Barbadians | 0.0 /100 | #284 | Tragic 20.2% |
| Arapaho | 0.0 /100 | #285 | Tragic 20.2% |
| West Indians | 0.0 /100 | #286 | Tragic 20.3% |
| Immigrants | Belize | 0.0 /100 | #287 | Tragic 20.3% |
| Immigrants | St. Vincent and the Grenadines | 0.0 /100 | #288 | Tragic 20.3% |
| Blackfeet | 0.0 /100 | #289 | Tragic 20.4% |
| Senegalese | 0.0 /100 | #290 | Tragic 20.6% |
| Immigrants | Latin America | 0.0 /100 | #291 | Tragic 20.6% |
| Yaqui | 0.0 /100 | #292 | Tragic 20.7% |
| Immigrants | Senegal | 0.0 /100 | #293 | Tragic 20.7% |
| Immigrants | Bahamas | 0.0 /100 | #294 | Tragic 20.7% |