Immigrants from Switzerland vs Immigrants from Belize Married-Couple Family Poverty
COMPARE
Immigrants from Switzerland
Immigrants from Belize
Married-Couple Family Poverty
Married-Couple Family Poverty Comparison
Immigrants from Switzerland
Immigrants from Belize
4.6%
MARRIED-COUPLE FAMILY POVERTY
98.5/ 100
METRIC RATING
90th/ 347
METRIC RANK
6.7%
MARRIED-COUPLE FAMILY POVERTY
0.0/ 100
METRIC RATING
300th/ 347
METRIC RANK
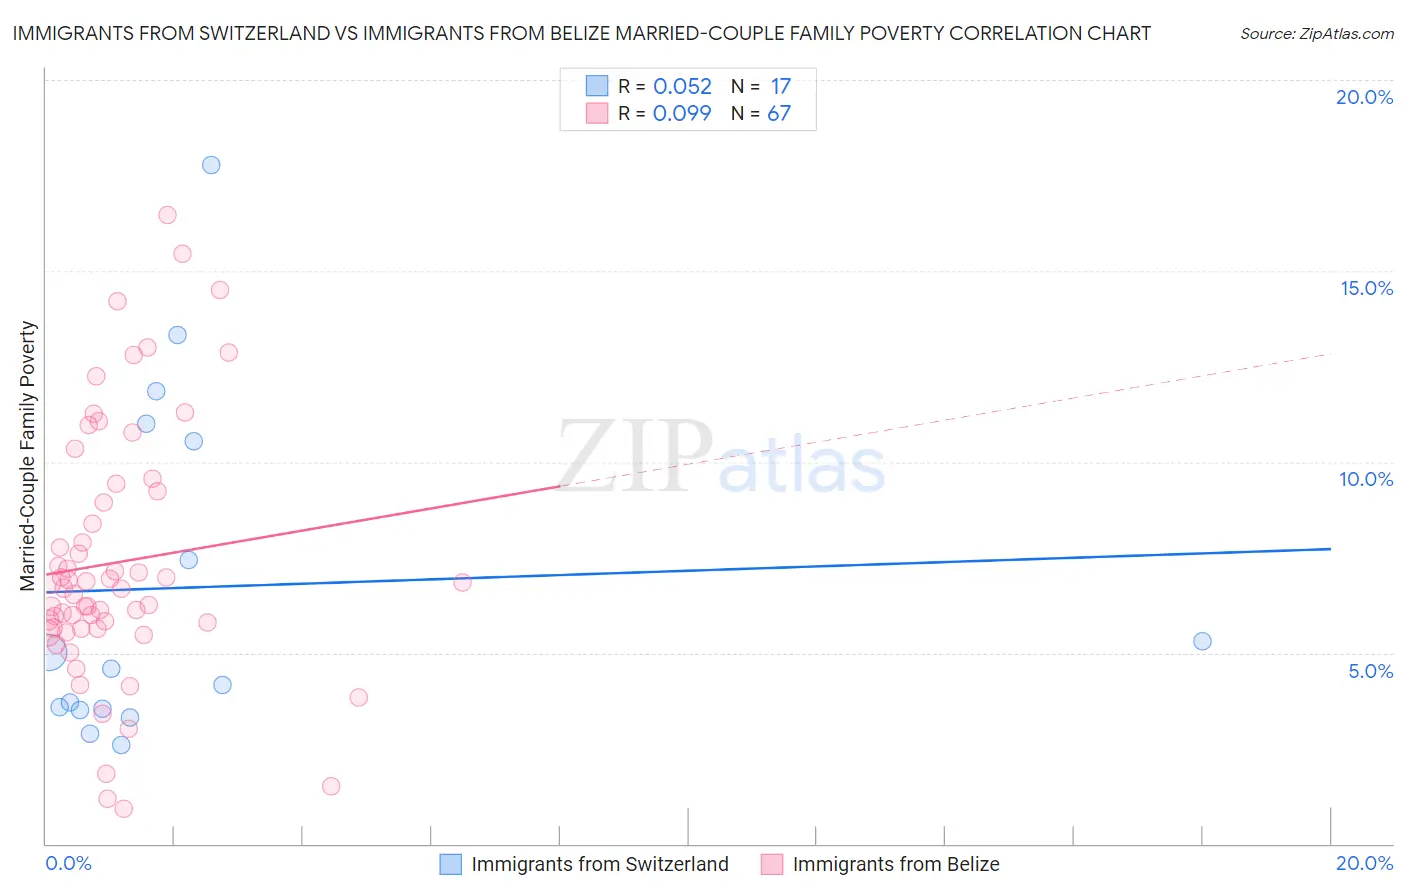
Immigrants from Switzerland vs Immigrants from Belize Married-Couple Family Poverty Correlation Chart
The statistical analysis conducted on geographies consisting of 147,526,625 people shows a slight positive correlation between the proportion of Immigrants from Switzerland and poverty level among married-couple families in the United States with a correlation coefficient (R) of 0.052 and weighted average of 4.6%. Similarly, the statistical analysis conducted on geographies consisting of 130,147,118 people shows a slight positive correlation between the proportion of Immigrants from Belize and poverty level among married-couple families in the United States with a correlation coefficient (R) of 0.099 and weighted average of 6.7%, a difference of 46.1%.
Married-Couple Family Poverty Correlation Summary
| Measurement | Immigrants from Switzerland | Immigrants from Belize |
| Minimum | 2.6% | 0.90% |
| Maximum | 17.8% | 16.5% |
| Range | 15.2% | 15.6% |
| Mean | 6.7% | 7.4% |
| Median | 4.6% | 6.7% |
| Interquartile 25% (IQ1) | 3.5% | 5.6% |
| Interquartile 75% (IQ3) | 10.8% | 9.2% |
| Interquartile Range (IQR) | 7.3% | 3.6% |
| Standard Deviation (Sample) | 4.5% | 3.3% |
| Standard Deviation (Population) | 4.4% | 3.3% |
Similar Demographics by Married-Couple Family Poverty
Demographics Similar to Immigrants from Switzerland by Married-Couple Family Poverty
In terms of married-couple family poverty, the demographic groups most similar to Immigrants from Switzerland are Basque (4.6%, a difference of 0.040%), Immigrants from Czechoslovakia (4.6%, a difference of 0.070%), Immigrants from Norway (4.6%, a difference of 0.11%), Bolivian (4.6%, a difference of 0.18%), and Immigrants from North Macedonia (4.6%, a difference of 0.28%).
| Demographics | Rating | Rank | Married-Couple Family Poverty |
| Immigrants | Denmark | 98.8 /100 | #83 | Exceptional 4.6% |
| Immigrants | Croatia | 98.7 /100 | #84 | Exceptional 4.6% |
| South Africans | 98.7 /100 | #85 | Exceptional 4.6% |
| Immigrants | Turkey | 98.6 /100 | #86 | Exceptional 4.6% |
| Immigrants | North Macedonia | 98.6 /100 | #87 | Exceptional 4.6% |
| Bolivians | 98.6 /100 | #88 | Exceptional 4.6% |
| Immigrants | Czechoslovakia | 98.5 /100 | #89 | Exceptional 4.6% |
| Immigrants | Switzerland | 98.5 /100 | #90 | Exceptional 4.6% |
| Basques | 98.5 /100 | #91 | Exceptional 4.6% |
| Immigrants | Norway | 98.4 /100 | #92 | Exceptional 4.6% |
| Koreans | 98.3 /100 | #93 | Exceptional 4.6% |
| Immigrants | Italy | 98.3 /100 | #94 | Exceptional 4.6% |
| Portuguese | 98.3 /100 | #95 | Exceptional 4.6% |
| Immigrants | Poland | 98.3 /100 | #96 | Exceptional 4.6% |
| Immigrants | Belgium | 98.2 /100 | #97 | Exceptional 4.6% |
Demographics Similar to Immigrants from Belize by Married-Couple Family Poverty
In terms of married-couple family poverty, the demographic groups most similar to Immigrants from Belize are Nicaraguan (6.7%, a difference of 0.15%), Central American (6.7%, a difference of 0.60%), Immigrants from Guyana (6.7%, a difference of 0.69%), Immigrants from Ecuador (6.7%, a difference of 0.74%), and Kiowa (6.6%, a difference of 0.76%).
| Demographics | Rating | Rank | Married-Couple Family Poverty |
| Arapaho | 0.0 /100 | #293 | Tragic 6.6% |
| Bahamians | 0.0 /100 | #294 | Tragic 6.6% |
| Immigrants | Uzbekistan | 0.0 /100 | #295 | Tragic 6.6% |
| U.S. Virgin Islanders | 0.0 /100 | #296 | Tragic 6.6% |
| Kiowa | 0.0 /100 | #297 | Tragic 6.6% |
| Immigrants | Guyana | 0.0 /100 | #298 | Tragic 6.7% |
| Nicaraguans | 0.0 /100 | #299 | Tragic 6.7% |
| Immigrants | Belize | 0.0 /100 | #300 | Tragic 6.7% |
| Central Americans | 0.0 /100 | #301 | Tragic 6.7% |
| Immigrants | Ecuador | 0.0 /100 | #302 | Tragic 6.7% |
| Immigrants | El Salvador | 0.0 /100 | #303 | Tragic 6.8% |
| Cubans | 0.0 /100 | #304 | Tragic 6.8% |
| Haitians | 0.0 /100 | #305 | Tragic 6.8% |
| Immigrants | Haiti | 0.0 /100 | #306 | Tragic 7.0% |
| Guatemalans | 0.0 /100 | #307 | Tragic 7.0% |