Mongolian vs Immigrants from Belize In Labor Force | Age 45-54

COMPARE

Mongolian
Race
Ancestry
AfghanAfricanAlaska NativeAlaskan AthabascanAlbanianAleutAlsatianAmericanApacheArabArapahoArgentineanArmenianAssyrian/Chaldean/SyriacAustralianAustrianBahamianBangladeshiBarbadianBasqueBelgianBelizeanBermudanBhutaneseBlackfeetBolivianBrazilianBritishBritish West IndianBulgarianBurmeseCajunCambodianCanadianCape VerdeanCarpatho RusynCelticCentral AmericanCentral American IndianCherokeeCheyenneChickasawChileanChineseChippewaChoctawColombianColvilleComancheCosta RicanCreeCreekCroatianCrowCubanCypriotCzechCzechoslovakianDanishDelawareDominicanDutchDutch West IndianEastern EuropeanEcuadorianEgyptianEnglishEstonianEthiopianEuropeanFijianFilipinoFinnishFrenchFrench American IndianFrench CanadianGermanGerman RussianGhanaianGreekGuamanian/ChamorroGuatemalanGuyaneseHaitianHmongHonduranHopiHoumaHungarianIcelanderIndian (Asian)IndonesianInupiatIranianIraqiIrishIroquoisIsraeliItalianJamaicanJapaneseJordanianKenyanKiowaKoreanLaotianLatvianLebaneseLiberianLithuanianLumbeeLuxembourgerMacedonianMalaysianMalteseMarshalleseMenomineeMexicanMexican American IndianMongolianMoroccanNative HawaiianNavajoNepaleseNew ZealanderNicaraguanNigerianNorthern EuropeanNorwegianOkinawanOsageOttawaPaiutePakistaniPalestinianPanamanianParaguayanPennsylvania GermanPeruvianPimaPolishPortuguesePotawatomiPuebloPuerto RicanPuget Sound SalishRomanianRussianSalvadoranSamoanScandinavianScotch-IrishScottishSeminoleSenegaleseSerbianShoshoneSierra LeoneanSiouxSlavicSlovakSloveneSomaliSouth AfricanSouth AmericanSouth American IndianSoviet UnionSpaniardSpanishSpanish AmericanSpanish American IndianSri LankanSubsaharan AfricanSudaneseSwedishSwissSyrianTaiwaneseThaiTlingit-HaidaTohono O'OdhamTonganTrinidadian and TobagonianTsimshianTurkishU.S. Virgin IslanderUgandanUkrainianUruguayanUteVenezuelanVietnameseWelshWest IndianYakamaYaquiYugoslavianYumanYup'ikZimbabwean
Immigration
NonimmigrantsImmigrantsAfghanistanAfricaAlbaniaArgentinaArmeniaAsiaAustraliaAustriaBahamasBangladeshBarbadosBelarusBelgiumBoliviaBosnia and HerzegovinaBrazilBulgariaBurma/MyanmarCabo VerdeCambodiaCameroonCanadaCaribbeanCentral AmericaChileChinaColombiaCongoCosta RicaCroatiaCubaCzechoslovakiaDenmarkDominicaDominican RepublicEastern AfricaEastern AsiaEastern EuropeEcuadorEgyptEl SalvadorEnglandEritreaEthiopiaEuropeFijiFranceGermanyGhanaGreeceGrenadaGuatemalaGuyanaHaitiHondurasHong KongHungaryIndiaIndonesiaIranIraqIrelandIsraelItalyJamaicaJapanJordanKazakhstanKenyaKoreaKuwaitLaosLatin AmericaLatviaLebanonLiberiaLithuaniaMalaysiaMexicoMicronesiaMiddle AfricaMoldovaMoroccoNepalNetherlandsNicaraguaNigeriaNorth AmericaNorth MacedoniaNorthern AfricaNorthern EuropeNorwayOceaniaPakistanPanamaPeruPhilippinesPolandPortugalRomaniaRussiaSaudi ArabiaScotlandSenegalSerbiaSierra LeoneSingaporeSomaliaSouth AfricaSouth AmericaSouth Central AsiaSouth Eastern AsiaSouthern EuropeSpainSri LankaSt. Vincent and the GrenadinesSudanSwedenSwitzerlandSyriaTaiwanThailandTrinidad and TobagoTurkeyUgandaUkraineUruguayUzbekistanVenezuelaVietnamWest IndiesWestern AfricaWestern AsiaWestern EuropeYemenZaireZimbabweAzores
Immigrants from Belize
Race
Ancestry
AfghanAfricanAlaska NativeAlaskan AthabascanAlbanianAleutAlsatianAmericanApacheArabArapahoArgentineanArmenianAssyrian/Chaldean/SyriacAustralianAustrianBahamianBangladeshiBarbadianBasqueBelgianBelizeanBermudanBhutaneseBlackfeetBolivianBrazilianBritishBritish West IndianBulgarianBurmeseCajunCambodianCanadianCape VerdeanCarpatho RusynCelticCentral AmericanCentral American IndianCherokeeCheyenneChickasawChileanChineseChippewaChoctawColombianColvilleComancheCosta RicanCreeCreekCroatianCrowCubanCypriotCzechCzechoslovakianDanishDelawareDominicanDutchDutch West IndianEastern EuropeanEcuadorianEgyptianEnglishEstonianEthiopianEuropeanFijianFilipinoFinnishFrenchFrench American IndianFrench CanadianGermanGerman RussianGhanaianGreekGuamanian/ChamorroGuatemalanGuyaneseHaitianHmongHonduranHopiHoumaHungarianIcelanderIndian (Asian)IndonesianInupiatIranianIraqiIrishIroquoisIsraeliItalianJamaicanJapaneseJordanianKenyanKiowaKoreanLaotianLatvianLebaneseLiberianLithuanianLumbeeLuxembourgerMacedonianMalaysianMalteseMarshalleseMenomineeMexicanMexican American IndianMoroccanNative HawaiianNavajoNepaleseNew ZealanderNicaraguanNigerianNorthern EuropeanNorwegianOkinawanOsageOttawaPaiutePakistaniPalestinianPanamanianParaguayanPennsylvania GermanPeruvianPimaPolishPortuguesePotawatomiPuebloPuerto RicanPuget Sound SalishRomanianRussianSalvadoranSamoanScandinavianScotch-IrishScottishSeminoleSenegaleseSerbianShoshoneSierra LeoneanSiouxSlavicSlovakSloveneSomaliSouth AfricanSouth AmericanSouth American IndianSoviet UnionSpaniardSpanishSpanish AmericanSpanish American IndianSri LankanSubsaharan AfricanSudaneseSwedishSwissSyrianTaiwaneseThaiTlingit-HaidaTohono O'OdhamTonganTrinidadian and TobagonianTsimshianTurkishU.S. Virgin IslanderUgandanUkrainianUruguayanUteVenezuelanVietnameseWelshWest IndianYakamaYaquiYugoslavianYumanYup'ikZimbabwean
Immigration
NonimmigrantsImmigrantsAfghanistanAfricaAlbaniaArgentinaArmeniaAsiaAustraliaAustriaBahamasBangladeshBarbadosBelarusBelgiumBelizeBoliviaBosnia and HerzegovinaBrazilBulgariaBurma/MyanmarCabo VerdeCambodiaCameroonCanadaCaribbeanCentral AmericaChileChinaColombiaCongoCosta RicaCroatiaCubaCzechoslovakiaDenmarkDominicaDominican RepublicEastern AfricaEastern AsiaEastern EuropeEcuadorEgyptEl SalvadorEnglandEritreaEthiopiaEuropeFijiFranceGermanyGhanaGreeceGrenadaGuatemalaGuyanaHaitiHondurasHong KongHungaryIndiaIndonesiaIranIraqIrelandIsraelItalyJamaicaJapanJordanKazakhstanKenyaKoreaKuwaitLaosLatin AmericaLatviaLebanonLiberiaLithuaniaMalaysiaMexicoMicronesiaMiddle AfricaMoldovaMoroccoNepalNetherlandsNicaraguaNigeriaNorth AmericaNorth MacedoniaNorthern AfricaNorthern EuropeNorwayOceaniaPakistanPanamaPeruPhilippinesPolandPortugalRomaniaRussiaSaudi ArabiaScotlandSenegalSerbiaSierra LeoneSingaporeSomaliaSouth AfricaSouth AmericaSouth Central AsiaSouth Eastern AsiaSouthern EuropeSpainSri LankaSt. Vincent and the GrenadinesSudanSwedenSwitzerlandSyriaTaiwanThailandTrinidad and TobagoTurkeyUgandaUkraineUruguayUzbekistanVenezuelaVietnamWest IndiesWestern AfricaWestern AsiaWestern EuropeYemenZaireZimbabweAzores
In Labor Force | Age 45-54
Income
Poverty
Unemployment
Labor Participation
Family Structure
Vehicle Availability
Education Level
Disability

In Labor Force | Age 45-54 Comparison

Mongolians

Immigrants from Belize

Exceptional
Tragic
83.3%
IN LABOR FORCE | AGE 45-54
94.2/ 100
METRIC RATING
100th/ 347
METRIC RANK
80.6%
IN LABOR FORCE | AGE 45-54
0.0/ 100
METRIC RATING
291st/ 347
METRIC RANK

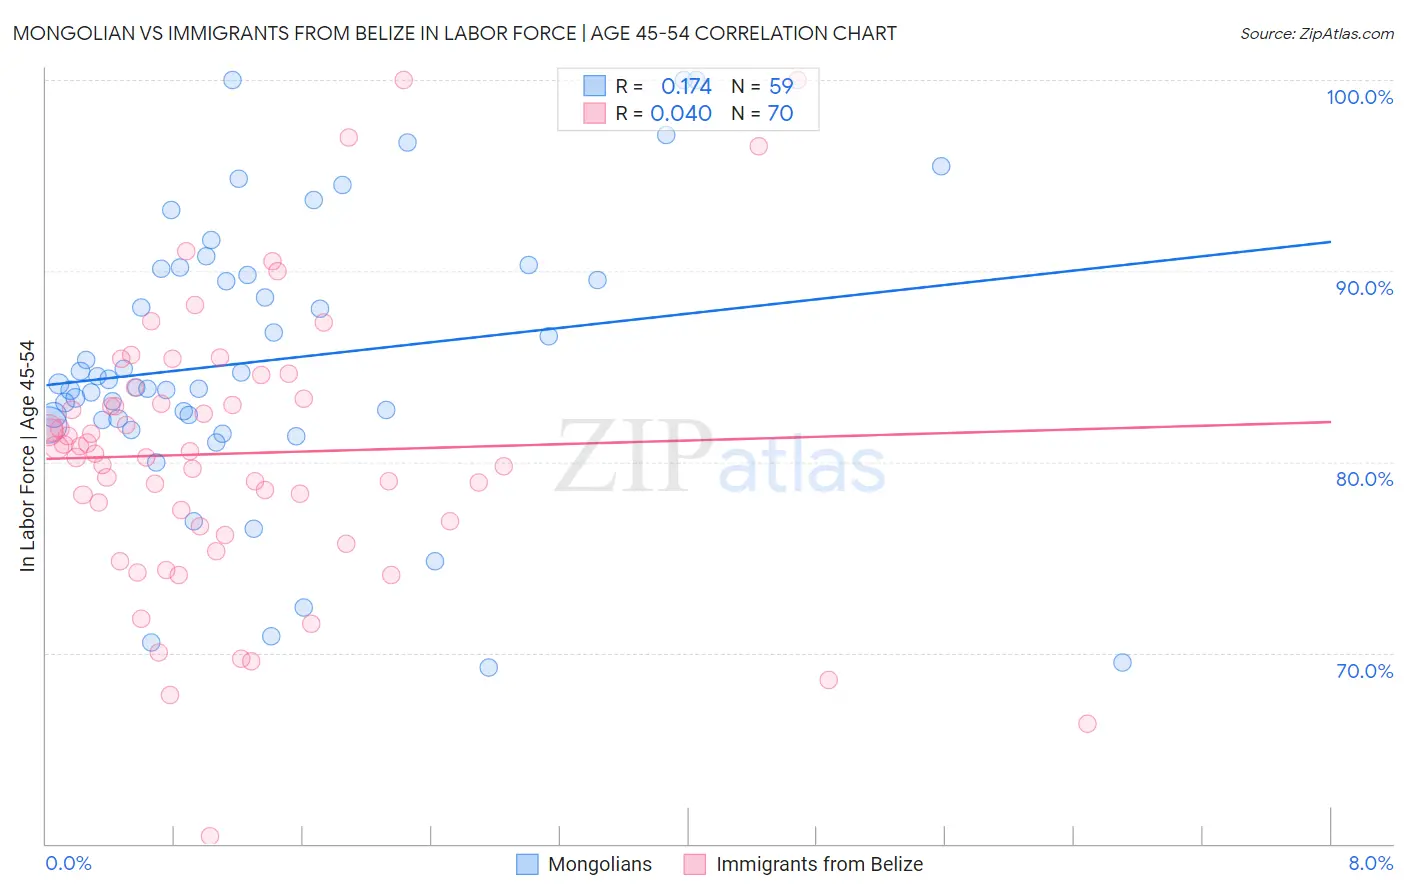
Mongolian vs Immigrants from Belize In Labor Force | Age 45-54 Correlation Chart

The statistical analysis conducted on geographies consisting of 140,286,535 people shows a poor positive correlation between the proportion of Mongolians and labor force participation rate among population between the ages 45 and 54 in the United States with a correlation coefficient (R) of 0.174 and weighted average of 83.3%. Similarly, the statistical analysis conducted on geographies consisting of 130,298,014 people shows no correlation between the proportion of Immigrants from Belize and labor force participation rate among population between the ages 45 and 54 in the United States with a correlation coefficient (R) of 0.040 and weighted average of 80.6%, a difference of 3.3%.
Mongolian vs Immigrants from Belize In Labor Force | Age 45-54

In Labor Force | Age 45-54 Correlation Summary

MeasurementMongolianImmigrants from Belize
Minimum69.2%60.4%
Maximum100.0%100.0%
Range30.8%39.6%
Mean85.3%80.4%
Median84.1%80.5%
Interquartile 25% (IQ1)82.2%76.7%
Interquartile 75% (IQ3)90.1%83.3%
Interquartile Range (IQR)7.9%6.6%
Standard Deviation (Sample)7.3%7.3%
Standard Deviation (Population)7.2%7.2%

Similar Demographics by In Labor Force | Age 45-54

Demographics Similar to Mongolians by In Labor Force | Age 45-54

In terms of in labor force | age 45-54, the demographic groups most similar to Mongolians are Immigrants from Middle Africa (83.3%, a difference of 0.0%), Immigrants from Belarus (83.3%, a difference of 0.0%), Maltese (83.3%, a difference of 0.010%), Immigrants from Singapore (83.3%, a difference of 0.010%), and Albanian (83.3%, a difference of 0.010%).
DemographicsRating | RankIn Labor Force | Age 45-54
Italians
95.1
/100
|
#93
Exceptional
83.3%
Argentineans
94.9
/100
|
#94
Exceptional
83.3%
Immigrants | Argentina
94.9
/100
|
#95
Exceptional
83.3%
Immigrants | Kuwait
94.8
/100
|
#96
Exceptional
83.3%
Palestinians
94.8
/100
|
#97
Exceptional
83.3%
Maltese
94.4
/100
|
#98
Exceptional
83.3%
Immigrants | Middle Africa
94.3
/100
|
#99
Exceptional
83.3%
Mongolians
94.2
/100
|
#100
Exceptional
83.3%
Immigrants | Belarus
94.1
/100
|
#101
Exceptional
83.3%
Immigrants | Singapore
93.9
/100
|
#102
Exceptional
83.3%
Albanians
93.9
/100
|
#103
Exceptional
83.3%
Immigrants | Romania
93.8
/100
|
#104
Exceptional
83.3%
Immigrants | South America
93.5
/100
|
#105
Exceptional
83.2%
Sri Lankans
93.2
/100
|
#106
Exceptional
83.2%
Iranians
92.9
/100
|
#107
Exceptional
83.2%

Demographics Similar to Immigrants from Belize by In Labor Force | Age 45-54

In terms of in labor force | age 45-54, the demographic groups most similar to Immigrants from Belize are Iroquois (80.6%, a difference of 0.030%), Osage (80.6%, a difference of 0.050%), Yakama (80.6%, a difference of 0.050%), Mexican American Indian (80.7%, a difference of 0.10%), and Nepalese (80.5%, a difference of 0.12%).
DemographicsRating | RankIn Labor Force | Age 45-54
Belizeans
0.0
/100
|
#284
Tragic
80.8%
Delaware
0.0
/100
|
#285
Tragic
80.8%
Immigrants | Dominica
0.0
/100
|
#286
Tragic
80.8%
Vietnamese
0.0
/100
|
#287
Tragic
80.8%
Cree
0.0
/100
|
#288
Tragic
80.8%
Immigrants | Bangladesh
0.0
/100
|
#289
Tragic
80.7%
Mexican American Indians
0.0
/100
|
#290
Tragic
80.7%
Immigrants | Belize
0.0
/100
|
#291
Tragic
80.6%
Iroquois
0.0
/100
|
#292
Tragic
80.6%
Osage
0.0
/100
|
#293
Tragic
80.6%
Yakama
0.0
/100
|
#294
Tragic
80.6%
Nepalese
0.0
/100
|
#295
Tragic
80.5%
Africans
0.0
/100
|
#296
Tragic
80.5%
Americans
0.0
/100
|
#297
Tragic
80.4%
Marshallese
0.0
/100
|
#298
Tragic
80.3%