Romanian vs Immigrants from Belize Married-Couple Family Poverty
COMPARE
Romanian
Immigrants from Belize
Married-Couple Family Poverty
Married-Couple Family Poverty Comparison
Romanians
Immigrants from Belize
4.8%
MARRIED-COUPLE FAMILY POVERTY
92.5/ 100
METRIC RATING
124th/ 347
METRIC RANK
6.7%
MARRIED-COUPLE FAMILY POVERTY
0.0/ 100
METRIC RATING
300th/ 347
METRIC RANK
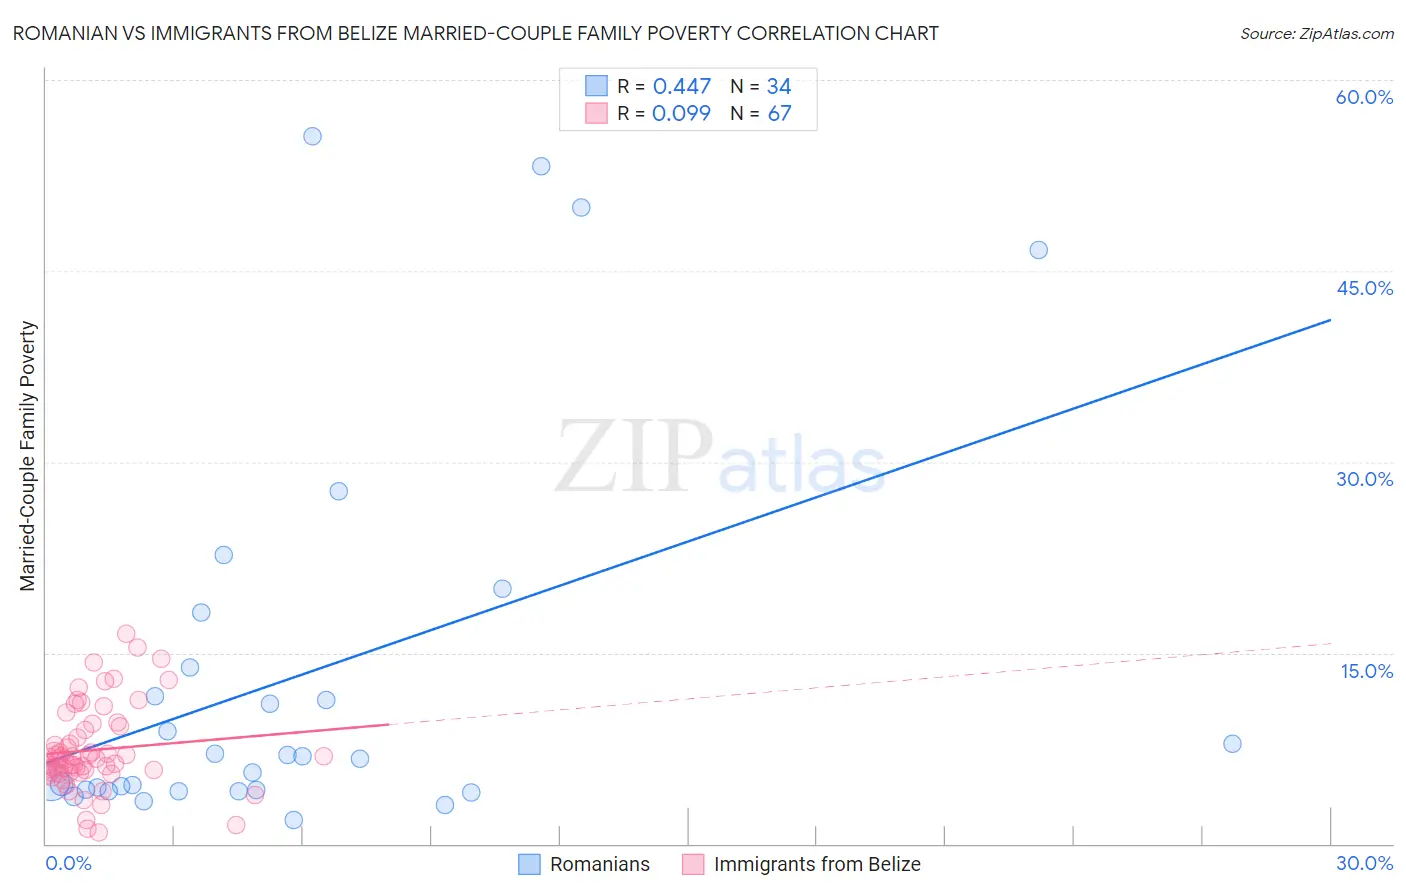
Romanian vs Immigrants from Belize Married-Couple Family Poverty Correlation Chart
The statistical analysis conducted on geographies consisting of 374,441,854 people shows a moderate positive correlation between the proportion of Romanians and poverty level among married-couple families in the United States with a correlation coefficient (R) of 0.447 and weighted average of 4.8%. Similarly, the statistical analysis conducted on geographies consisting of 130,147,118 people shows a slight positive correlation between the proportion of Immigrants from Belize and poverty level among married-couple families in the United States with a correlation coefficient (R) of 0.099 and weighted average of 6.7%, a difference of 38.5%.
Married-Couple Family Poverty Correlation Summary
| Measurement | Romanian | Immigrants from Belize |
| Minimum | 1.9% | 0.90% |
| Maximum | 55.6% | 16.5% |
| Range | 53.6% | 15.6% |
| Mean | 13.3% | 7.4% |
| Median | 6.8% | 6.7% |
| Interquartile 25% (IQ1) | 4.2% | 5.6% |
| Interquartile 75% (IQ3) | 13.9% | 9.2% |
| Interquartile Range (IQR) | 9.6% | 3.6% |
| Standard Deviation (Sample) | 15.4% | 3.3% |
| Standard Deviation (Population) | 15.1% | 3.3% |
Similar Demographics by Married-Couple Family Poverty
Demographics Similar to Romanians by Married-Couple Family Poverty
In terms of married-couple family poverty, the demographic groups most similar to Romanians are Immigrants from Bosnia and Herzegovina (4.8%, a difference of 0.020%), Immigrants from Asia (4.8%, a difference of 0.090%), Egyptian (4.8%, a difference of 0.23%), Jordanian (4.8%, a difference of 0.27%), and White/Caucasian (4.8%, a difference of 0.29%).
| Demographics | Rating | Rank | Married-Couple Family Poverty |
| Kenyans | 94.7 /100 | #117 | Exceptional 4.8% |
| Immigrants | Philippines | 94.6 /100 | #118 | Exceptional 4.8% |
| Immigrants | Eastern Asia | 94.0 /100 | #119 | Exceptional 4.8% |
| Immigrants | Southern Europe | 93.4 /100 | #120 | Exceptional 4.8% |
| Indians (Asian) | 93.2 /100 | #121 | Exceptional 4.8% |
| Whites/Caucasians | 93.1 /100 | #122 | Exceptional 4.8% |
| Jordanians | 93.1 /100 | #123 | Exceptional 4.8% |
| Romanians | 92.5 /100 | #124 | Exceptional 4.8% |
| Immigrants | Bosnia and Herzegovina | 92.5 /100 | #125 | Exceptional 4.8% |
| Immigrants | Asia | 92.3 /100 | #126 | Exceptional 4.8% |
| Egyptians | 92.0 /100 | #127 | Exceptional 4.8% |
| Palestinians | 91.2 /100 | #128 | Exceptional 4.9% |
| Immigrants | Pakistan | 90.7 /100 | #129 | Exceptional 4.9% |
| Soviet Union | 90.7 /100 | #130 | Exceptional 4.9% |
| Immigrants | Eastern Europe | 90.5 /100 | #131 | Exceptional 4.9% |
Demographics Similar to Immigrants from Belize by Married-Couple Family Poverty
In terms of married-couple family poverty, the demographic groups most similar to Immigrants from Belize are Nicaraguan (6.7%, a difference of 0.15%), Central American (6.7%, a difference of 0.60%), Immigrants from Guyana (6.7%, a difference of 0.69%), Immigrants from Ecuador (6.7%, a difference of 0.74%), and Kiowa (6.6%, a difference of 0.76%).
| Demographics | Rating | Rank | Married-Couple Family Poverty |
| Arapaho | 0.0 /100 | #293 | Tragic 6.6% |
| Bahamians | 0.0 /100 | #294 | Tragic 6.6% |
| Immigrants | Uzbekistan | 0.0 /100 | #295 | Tragic 6.6% |
| U.S. Virgin Islanders | 0.0 /100 | #296 | Tragic 6.6% |
| Kiowa | 0.0 /100 | #297 | Tragic 6.6% |
| Immigrants | Guyana | 0.0 /100 | #298 | Tragic 6.7% |
| Nicaraguans | 0.0 /100 | #299 | Tragic 6.7% |
| Immigrants | Belize | 0.0 /100 | #300 | Tragic 6.7% |
| Central Americans | 0.0 /100 | #301 | Tragic 6.7% |
| Immigrants | Ecuador | 0.0 /100 | #302 | Tragic 6.7% |
| Immigrants | El Salvador | 0.0 /100 | #303 | Tragic 6.8% |
| Cubans | 0.0 /100 | #304 | Tragic 6.8% |
| Haitians | 0.0 /100 | #305 | Tragic 6.8% |
| Immigrants | Haiti | 0.0 /100 | #306 | Tragic 7.0% |
| Guatemalans | 0.0 /100 | #307 | Tragic 7.0% |