Lumbee vs Palestinian Single Father Households
COMPARE
Lumbee
Palestinian
Single Father Households
Single Father Households Comparison
Lumbee
Palestinians
2.8%
SINGLE FATHER HOUSEHOLDS
0.0/ 100
METRIC RATING
299th/ 347
METRIC RANK
2.2%
SINGLE FATHER HOUSEHOLDS
98.6/ 100
METRIC RATING
105th/ 347
METRIC RANK
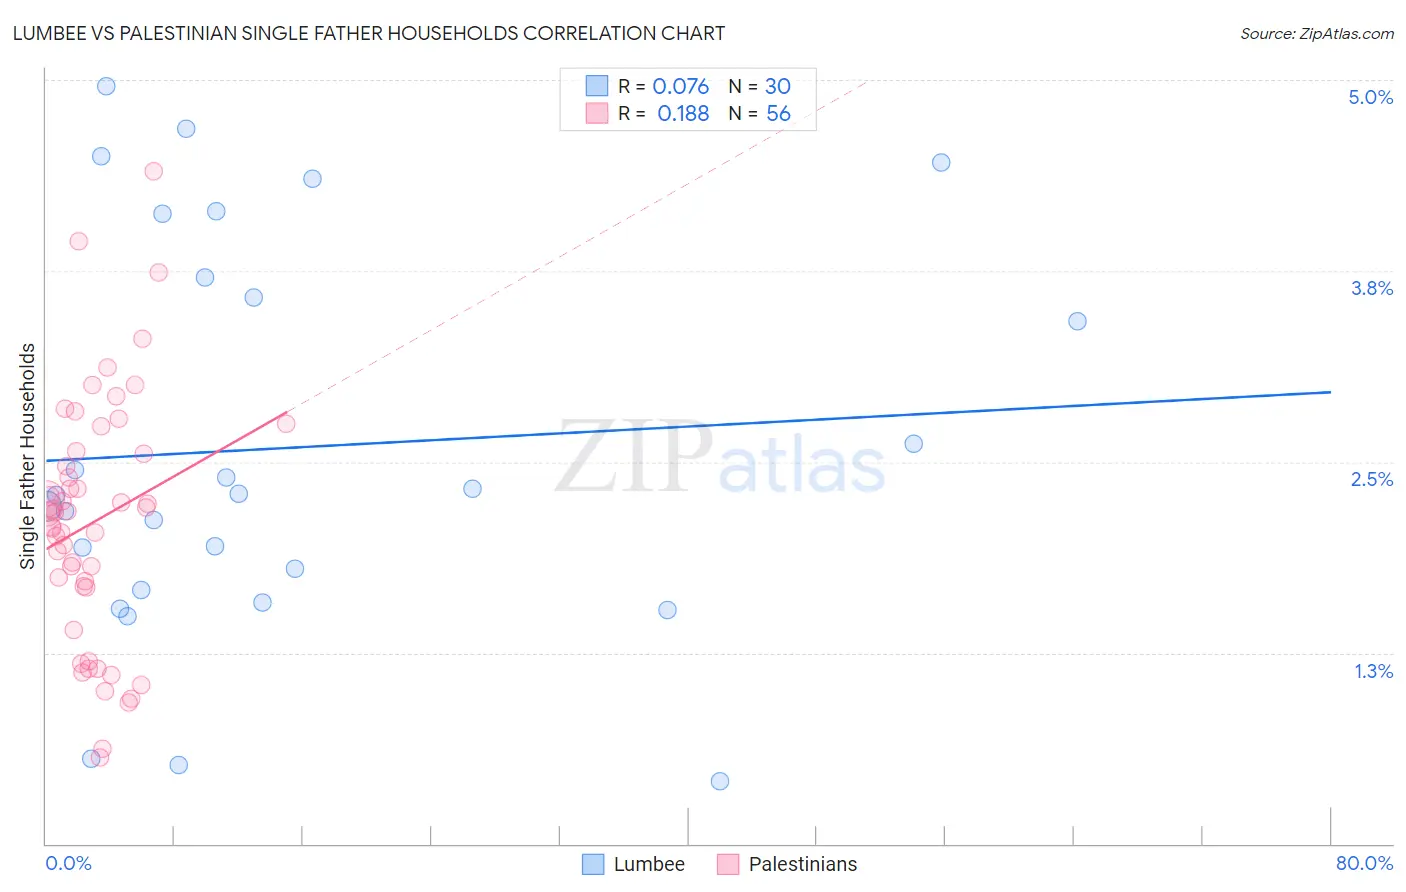
Lumbee vs Palestinian Single Father Households Correlation Chart
The statistical analysis conducted on geographies consisting of 91,890,411 people shows a slight positive correlation between the proportion of Lumbee and percentage of single father households in the United States with a correlation coefficient (R) of 0.076 and weighted average of 2.8%. Similarly, the statistical analysis conducted on geographies consisting of 215,869,880 people shows a poor positive correlation between the proportion of Palestinians and percentage of single father households in the United States with a correlation coefficient (R) of 0.188 and weighted average of 2.2%, a difference of 29.0%.
Single Father Households Correlation Summary
| Measurement | Lumbee | Palestinian |
| Minimum | 0.41% | 0.57% |
| Maximum | 5.0% | 4.4% |
| Range | 4.5% | 3.8% |
| Mean | 2.6% | 2.1% |
| Median | 2.3% | 2.2% |
| Interquartile 25% (IQ1) | 1.7% | 1.7% |
| Interquartile 75% (IQ3) | 3.7% | 2.6% |
| Interquartile Range (IQR) | 2.0% | 0.88% |
| Standard Deviation (Sample) | 1.3% | 0.81% |
| Standard Deviation (Population) | 1.3% | 0.80% |
Similar Demographics by Single Father Households
Demographics Similar to Lumbee by Single Father Households
In terms of single father households, the demographic groups most similar to Lumbee are Cree (2.8%, a difference of 0.38%), Kiowa (2.8%, a difference of 0.40%), Immigrants from Latin America (2.8%, a difference of 0.45%), Honduran (2.8%, a difference of 0.87%), and Japanese (2.8%, a difference of 0.95%).
| Demographics | Rating | Rank | Single Father Households |
| Choctaw | 0.0 /100 | #292 | Tragic 2.7% |
| Immigrants | Fiji | 0.0 /100 | #293 | Tragic 2.7% |
| Malaysians | 0.0 /100 | #294 | Tragic 2.7% |
| Chickasaw | 0.0 /100 | #295 | Tragic 2.8% |
| Japanese | 0.0 /100 | #296 | Tragic 2.8% |
| Hondurans | 0.0 /100 | #297 | Tragic 2.8% |
| Cree | 0.0 /100 | #298 | Tragic 2.8% |
| Lumbee | 0.0 /100 | #299 | Tragic 2.8% |
| Kiowa | 0.0 /100 | #300 | Tragic 2.8% |
| Immigrants | Latin America | 0.0 /100 | #301 | Tragic 2.8% |
| Spanish Americans | 0.0 /100 | #302 | Tragic 2.8% |
| Immigrants | Honduras | 0.0 /100 | #303 | Tragic 2.8% |
| Mexican American Indians | 0.0 /100 | #304 | Tragic 2.8% |
| Hispanics or Latinos | 0.0 /100 | #305 | Tragic 2.8% |
| Immigrants | Azores | 0.0 /100 | #306 | Tragic 2.8% |
Demographics Similar to Palestinians by Single Father Households
In terms of single father households, the demographic groups most similar to Palestinians are Immigrants from Southern Europe (2.2%, a difference of 0.11%), Slovene (2.2%, a difference of 0.23%), Immigrants from Netherlands (2.2%, a difference of 0.25%), Barbadian (2.2%, a difference of 0.29%), and Alsatian (2.1%, a difference of 0.37%).
| Demographics | Rating | Rank | Single Father Households |
| Guyanese | 99.1 /100 | #98 | Exceptional 2.1% |
| South Africans | 99.1 /100 | #99 | Exceptional 2.1% |
| Immigrants | Northern Africa | 99.0 /100 | #100 | Exceptional 2.1% |
| Immigrants | Western Europe | 98.9 /100 | #101 | Exceptional 2.1% |
| Argentineans | 98.9 /100 | #102 | Exceptional 2.1% |
| Lebanese | 98.9 /100 | #103 | Exceptional 2.1% |
| Alsatians | 98.9 /100 | #104 | Exceptional 2.1% |
| Palestinians | 98.6 /100 | #105 | Exceptional 2.2% |
| Immigrants | Southern Europe | 98.6 /100 | #106 | Exceptional 2.2% |
| Slovenes | 98.5 /100 | #107 | Exceptional 2.2% |
| Immigrants | Netherlands | 98.5 /100 | #108 | Exceptional 2.2% |
| Barbadians | 98.4 /100 | #109 | Exceptional 2.2% |
| Italians | 98.3 /100 | #110 | Exceptional 2.2% |
| Immigrants | Canada | 98.3 /100 | #111 | Exceptional 2.2% |
| Immigrants | Trinidad and Tobago | 98.2 /100 | #112 | Exceptional 2.2% |