Lumbee vs Moroccan Female Poverty
COMPARE
Lumbee
Moroccan
Female Poverty
Female Poverty Comparison
Lumbee
Moroccans
23.5%
FEMALE POVERTY
0.0/ 100
METRIC RATING
343rd/ 347
METRIC RANK
14.3%
FEMALE POVERTY
7.2/ 100
METRIC RATING
211th/ 347
METRIC RANK
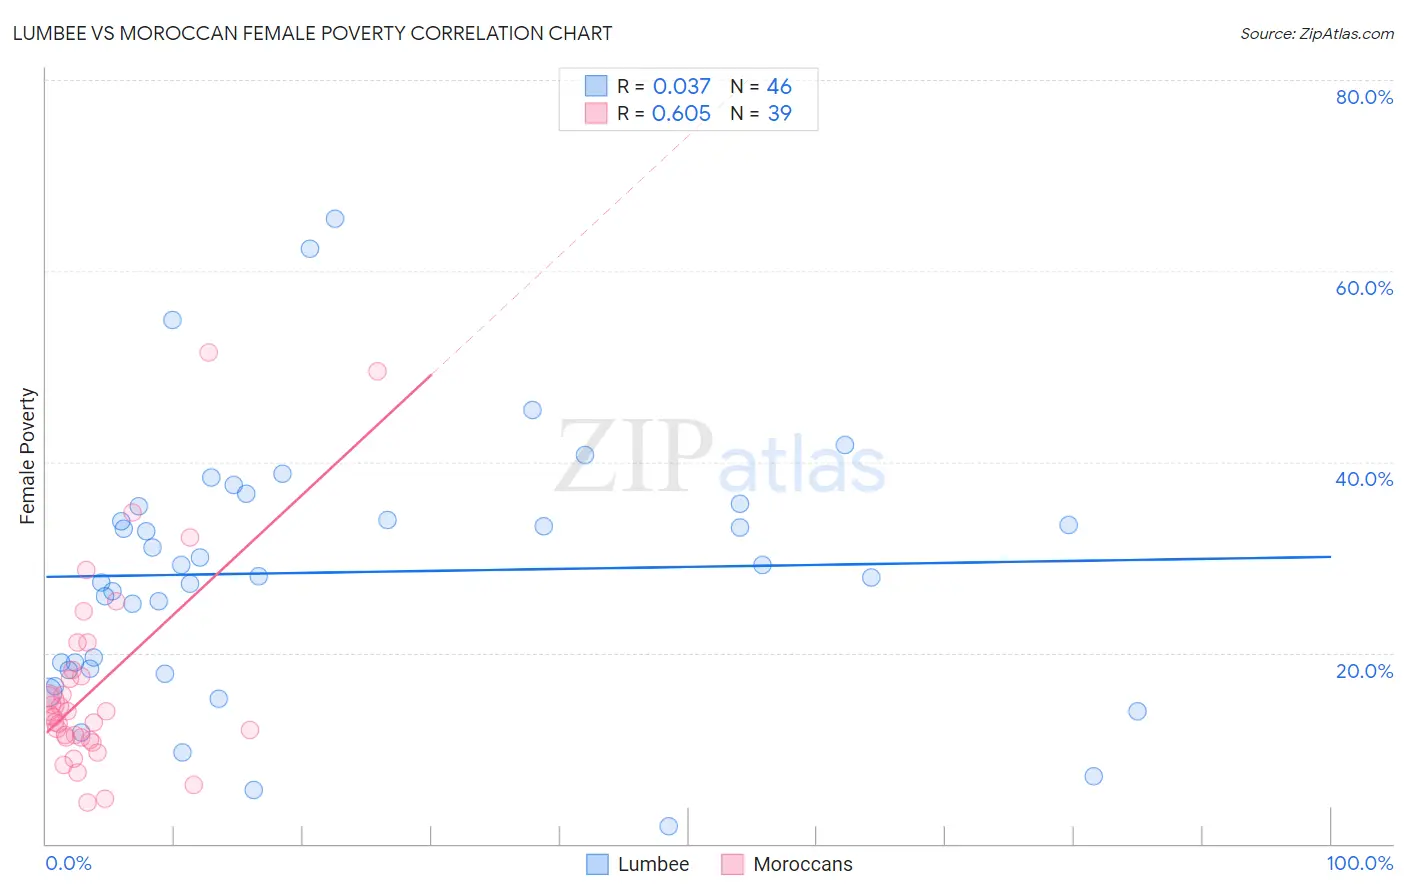
Lumbee vs Moroccan Female Poverty Correlation Chart
The statistical analysis conducted on geographies consisting of 92,256,229 people shows no correlation between the proportion of Lumbee and poverty level among females in the United States with a correlation coefficient (R) of 0.037 and weighted average of 23.5%. Similarly, the statistical analysis conducted on geographies consisting of 201,724,575 people shows a significant positive correlation between the proportion of Moroccans and poverty level among females in the United States with a correlation coefficient (R) of 0.605 and weighted average of 14.3%, a difference of 64.7%.
Female Poverty Correlation Summary
| Measurement | Lumbee | Moroccan |
| Minimum | 1.9% | 4.4% |
| Maximum | 65.5% | 51.5% |
| Range | 63.6% | 47.1% |
| Mean | 28.4% | 16.6% |
| Median | 28.6% | 13.4% |
| Interquartile 25% (IQ1) | 18.3% | 11.1% |
| Interquartile 75% (IQ3) | 35.3% | 18.2% |
| Interquartile Range (IQR) | 17.0% | 7.1% |
| Standard Deviation (Sample) | 13.4% | 10.5% |
| Standard Deviation (Population) | 13.3% | 10.4% |
Similar Demographics by Female Poverty
Demographics Similar to Lumbee by Female Poverty
In terms of female poverty, the demographic groups most similar to Lumbee are Pima (23.6%, a difference of 0.31%), Navajo (23.9%, a difference of 1.6%), Immigrants from Yemen (22.8%, a difference of 3.0%), Crow (22.1%, a difference of 6.2%), and Puerto Rican (25.2%, a difference of 7.1%).
| Demographics | Rating | Rank | Female Poverty |
| Immigrants | Dominican Republic | 0.0 /100 | #333 | Tragic 19.3% |
| Houma | 0.0 /100 | #334 | Tragic 20.0% |
| Cheyenne | 0.0 /100 | #335 | Tragic 20.2% |
| Pueblo | 0.0 /100 | #336 | Tragic 20.7% |
| Yuman | 0.0 /100 | #337 | Tragic 20.8% |
| Sioux | 0.0 /100 | #338 | Tragic 20.9% |
| Hopi | 0.0 /100 | #339 | Tragic 21.0% |
| Yup'ik | 0.0 /100 | #340 | Tragic 21.5% |
| Crow | 0.0 /100 | #341 | Tragic 22.1% |
| Immigrants | Yemen | 0.0 /100 | #342 | Tragic 22.8% |
| Lumbee | 0.0 /100 | #343 | Tragic 23.5% |
| Pima | 0.0 /100 | #344 | Tragic 23.6% |
| Navajo | 0.0 /100 | #345 | Tragic 23.9% |
| Puerto Ricans | 0.0 /100 | #346 | Tragic 25.2% |
| Tohono O'odham | 0.0 /100 | #347 | Tragic 25.9% |
Demographics Similar to Moroccans by Female Poverty
In terms of female poverty, the demographic groups most similar to Moroccans are Malaysian (14.3%, a difference of 0.080%), Panamanian (14.2%, a difference of 0.17%), Immigrants from the Azores (14.2%, a difference of 0.23%), Immigrants from Eastern Africa (14.2%, a difference of 0.58%), and Bermudan (14.4%, a difference of 0.63%).
| Demographics | Rating | Rank | Female Poverty |
| Spaniards | 18.9 /100 | #204 | Poor 13.9% |
| Ugandans | 15.4 /100 | #205 | Poor 14.0% |
| Immigrants | Uruguay | 14.0 /100 | #206 | Poor 14.0% |
| Immigrants | Eastern Africa | 9.0 /100 | #207 | Tragic 14.2% |
| Immigrants | Azores | 7.9 /100 | #208 | Tragic 14.2% |
| Panamanians | 7.7 /100 | #209 | Tragic 14.2% |
| Malaysians | 7.4 /100 | #210 | Tragic 14.3% |
| Moroccans | 7.2 /100 | #211 | Tragic 14.3% |
| Bermudans | 5.5 /100 | #212 | Tragic 14.4% |
| Alaskan Athabascans | 5.3 /100 | #213 | Tragic 14.4% |
| Marshallese | 5.0 /100 | #214 | Tragic 14.4% |
| Immigrants | Panama | 4.7 /100 | #215 | Tragic 14.4% |
| Immigrants | Thailand | 4.5 /100 | #216 | Tragic 14.4% |
| Immigrants | Immigrants | 4.5 /100 | #217 | Tragic 14.4% |
| Immigrants | Uzbekistan | 4.4 /100 | #218 | Tragic 14.4% |