Lumbee vs Paiute Female Poverty
COMPARE
Lumbee
Paiute
Female Poverty
Female Poverty Comparison
Lumbee
Paiute
23.5%
FEMALE POVERTY
0.0/ 100
METRIC RATING
343rd/ 347
METRIC RANK
17.7%
FEMALE POVERTY
0.0/ 100
METRIC RATING
323rd/ 347
METRIC RANK
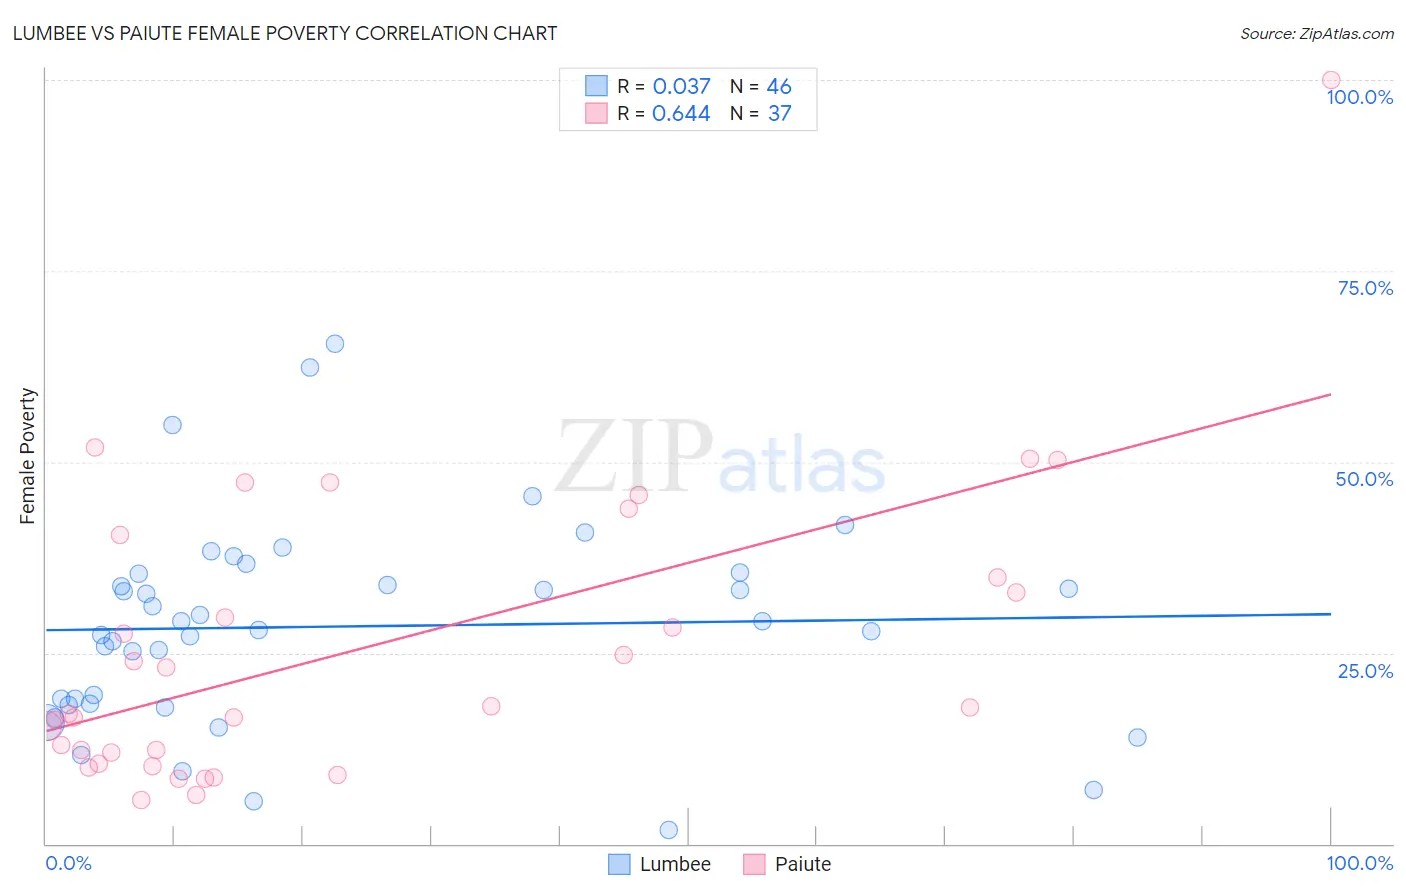
Lumbee vs Paiute Female Poverty Correlation Chart
The statistical analysis conducted on geographies consisting of 92,256,229 people shows no correlation between the proportion of Lumbee and poverty level among females in the United States with a correlation coefficient (R) of 0.037 and weighted average of 23.5%. Similarly, the statistical analysis conducted on geographies consisting of 58,391,472 people shows a significant positive correlation between the proportion of Paiute and poverty level among females in the United States with a correlation coefficient (R) of 0.644 and weighted average of 17.7%, a difference of 32.8%.
Female Poverty Correlation Summary
| Measurement | Lumbee | Paiute |
| Minimum | 1.9% | 5.7% |
| Maximum | 65.5% | 100.0% |
| Range | 63.6% | 94.3% |
| Mean | 28.4% | 25.6% |
| Median | 28.6% | 17.8% |
| Interquartile 25% (IQ1) | 18.3% | 11.2% |
| Interquartile 75% (IQ3) | 35.3% | 37.6% |
| Interquartile Range (IQR) | 17.0% | 26.4% |
| Standard Deviation (Sample) | 13.4% | 19.3% |
| Standard Deviation (Population) | 13.3% | 19.0% |
Demographics Similar to Lumbee and Paiute by Female Poverty
In terms of female poverty, the demographic groups most similar to Lumbee are Immigrants from Yemen (22.8%, a difference of 3.0%), Crow (22.1%, a difference of 6.2%), Yup'ik (21.5%, a difference of 9.4%), Hopi (21.0%, a difference of 12.2%), and Sioux (20.9%, a difference of 12.6%). Similarly, the demographic groups most similar to Paiute are Immigrants from Honduras (17.7%, a difference of 0.18%), Colville (17.8%, a difference of 0.34%), Central American Indian (18.0%, a difference of 1.9%), Yakama (18.0%, a difference of 2.0%), and Black/African American (18.6%, a difference of 5.0%).
| Demographics | Rating | Rank | Female Poverty |
| Paiute | 0.0 /100 | #323 | Tragic 17.7% |
| Immigrants | Honduras | 0.0 /100 | #324 | Tragic 17.7% |
| Colville | 0.0 /100 | #325 | Tragic 17.8% |
| Central American Indians | 0.0 /100 | #326 | Tragic 18.0% |
| Yakama | 0.0 /100 | #327 | Tragic 18.0% |
| Blacks/African Americans | 0.0 /100 | #328 | Tragic 18.6% |
| Kiowa | 0.0 /100 | #329 | Tragic 18.6% |
| Dominicans | 0.0 /100 | #330 | Tragic 19.1% |
| Natives/Alaskans | 0.0 /100 | #331 | Tragic 19.2% |
| Apache | 0.0 /100 | #332 | Tragic 19.2% |
| Immigrants | Dominican Republic | 0.0 /100 | #333 | Tragic 19.3% |
| Houma | 0.0 /100 | #334 | Tragic 20.0% |
| Cheyenne | 0.0 /100 | #335 | Tragic 20.2% |
| Pueblo | 0.0 /100 | #336 | Tragic 20.7% |
| Yuman | 0.0 /100 | #337 | Tragic 20.8% |
| Sioux | 0.0 /100 | #338 | Tragic 20.9% |
| Hopi | 0.0 /100 | #339 | Tragic 21.0% |
| Yup'ik | 0.0 /100 | #340 | Tragic 21.5% |
| Crow | 0.0 /100 | #341 | Tragic 22.1% |
| Immigrants | Yemen | 0.0 /100 | #342 | Tragic 22.8% |
| Lumbee | 0.0 /100 | #343 | Tragic 23.5% |