Lumbee vs Moroccan Kindergarten
COMPARE
Lumbee
Moroccan
Kindergarten
Kindergarten Comparison
Lumbee
Moroccans
98.5%
KINDERGARTEN
99.9/ 100
METRIC RATING
43rd/ 347
METRIC RANK
97.8%
KINDERGARTEN
8.9/ 100
METRIC RATING
212th/ 347
METRIC RANK
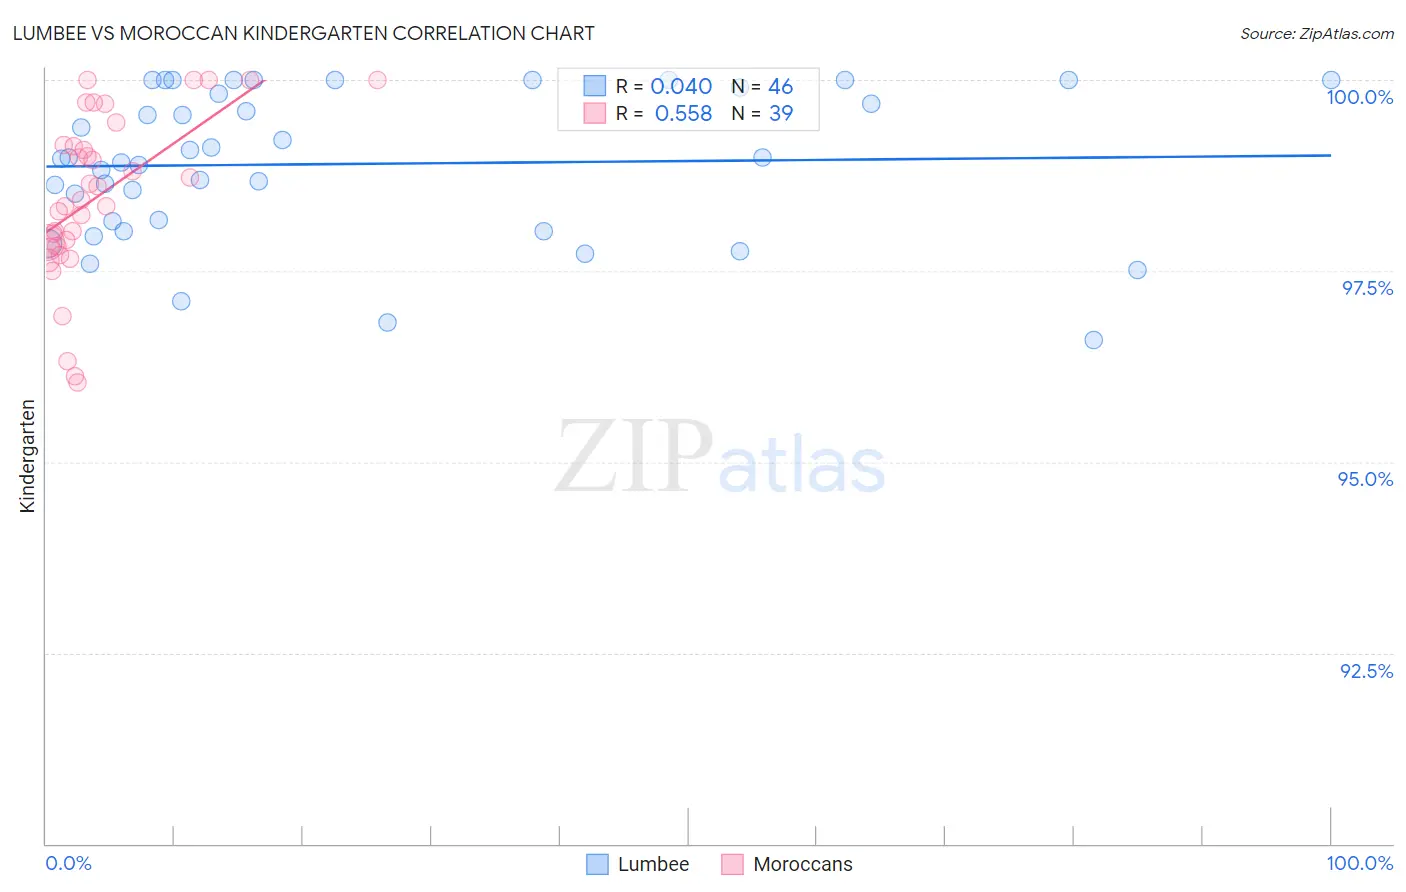
Lumbee vs Moroccan Kindergarten Correlation Chart
The statistical analysis conducted on geographies consisting of 92,298,794 people shows no correlation between the proportion of Lumbee and percentage of population with at least kindergarten education in the United States with a correlation coefficient (R) of 0.040 and weighted average of 98.5%. Similarly, the statistical analysis conducted on geographies consisting of 201,817,667 people shows a substantial positive correlation between the proportion of Moroccans and percentage of population with at least kindergarten education in the United States with a correlation coefficient (R) of 0.558 and weighted average of 97.8%, a difference of 0.72%.
Kindergarten Correlation Summary
| Measurement | Lumbee | Moroccan |
| Minimum | 96.6% | 96.0% |
| Maximum | 100.0% | 100.0% |
| Range | 3.4% | 4.0% |
| Mean | 98.9% | 98.5% |
| Median | 99.0% | 98.4% |
| Interquartile 25% (IQ1) | 98.1% | 97.8% |
| Interquartile 75% (IQ3) | 99.9% | 99.1% |
| Interquartile Range (IQR) | 1.8% | 1.3% |
| Standard Deviation (Sample) | 0.96% | 1.1% |
| Standard Deviation (Population) | 0.95% | 1.1% |
Similar Demographics by Kindergarten
Demographics Similar to Lumbee by Kindergarten
In terms of kindergarten, the demographic groups most similar to Lumbee are Northern European (98.5%, a difference of 0.0%), Belgian (98.5%, a difference of 0.0%), Luxembourger (98.5%, a difference of 0.010%), Eastern European (98.5%, a difference of 0.010%), and Native Hawaiian (98.5%, a difference of 0.010%).
| Demographics | Rating | Rank | Kindergarten |
| British | 99.9 /100 | #36 | Exceptional 98.5% |
| Italians | 99.9 /100 | #37 | Exceptional 98.5% |
| Latvians | 99.9 /100 | #38 | Exceptional 98.5% |
| Chippewa | 99.9 /100 | #39 | Exceptional 98.5% |
| Luxembourgers | 99.9 /100 | #40 | Exceptional 98.5% |
| Eastern Europeans | 99.9 /100 | #41 | Exceptional 98.5% |
| Native Hawaiians | 99.9 /100 | #42 | Exceptional 98.5% |
| Lumbee | 99.9 /100 | #43 | Exceptional 98.5% |
| Northern Europeans | 99.9 /100 | #44 | Exceptional 98.5% |
| Belgians | 99.9 /100 | #45 | Exceptional 98.5% |
| Hungarians | 99.9 /100 | #46 | Exceptional 98.5% |
| Czechoslovakians | 99.8 /100 | #47 | Exceptional 98.4% |
| Ottawa | 99.8 /100 | #48 | Exceptional 98.4% |
| Kiowa | 99.8 /100 | #49 | Exceptional 98.4% |
| Whites/Caucasians | 99.8 /100 | #50 | Exceptional 98.4% |
Demographics Similar to Moroccans by Kindergarten
In terms of kindergarten, the demographic groups most similar to Moroccans are Laotian (97.8%, a difference of 0.010%), South American Indian (97.8%, a difference of 0.010%), Uruguayan (97.8%, a difference of 0.010%), Costa Rican (97.8%, a difference of 0.020%), and Immigrants from Oceania (97.8%, a difference of 0.020%).
| Demographics | Rating | Rank | Kindergarten |
| Immigrants | Southern Europe | 18.0 /100 | #205 | Poor 97.8% |
| Immigrants | Albania | 16.4 /100 | #206 | Poor 97.8% |
| Africans | 16.1 /100 | #207 | Poor 97.8% |
| Immigrants | Northern Africa | 12.0 /100 | #208 | Poor 97.8% |
| Costa Ricans | 11.6 /100 | #209 | Poor 97.8% |
| Immigrants | Oceania | 11.1 /100 | #210 | Poor 97.8% |
| Laotians | 10.5 /100 | #211 | Poor 97.8% |
| Moroccans | 8.9 /100 | #212 | Tragic 97.8% |
| South American Indians | 7.7 /100 | #213 | Tragic 97.8% |
| Uruguayans | 7.5 /100 | #214 | Tragic 97.8% |
| Immigrants | Bahamas | 7.4 /100 | #215 | Tragic 97.8% |
| Samoans | 6.9 /100 | #216 | Tragic 97.8% |
| Bahamians | 6.6 /100 | #217 | Tragic 97.8% |
| Immigrants | Morocco | 5.4 /100 | #218 | Tragic 97.7% |
| Immigrants | Panama | 5.0 /100 | #219 | Tragic 97.7% |