Lumbee vs Native/Alaskan Female Poverty
COMPARE
Lumbee
Native/Alaskan
Female Poverty
Female Poverty Comparison
Lumbee
Natives/Alaskans
23.5%
FEMALE POVERTY
0.0/ 100
METRIC RATING
343rd/ 347
METRIC RANK
19.2%
FEMALE POVERTY
0.0/ 100
METRIC RATING
331st/ 347
METRIC RANK
Lumbee vs Native/Alaskan Female Poverty Correlation Chart
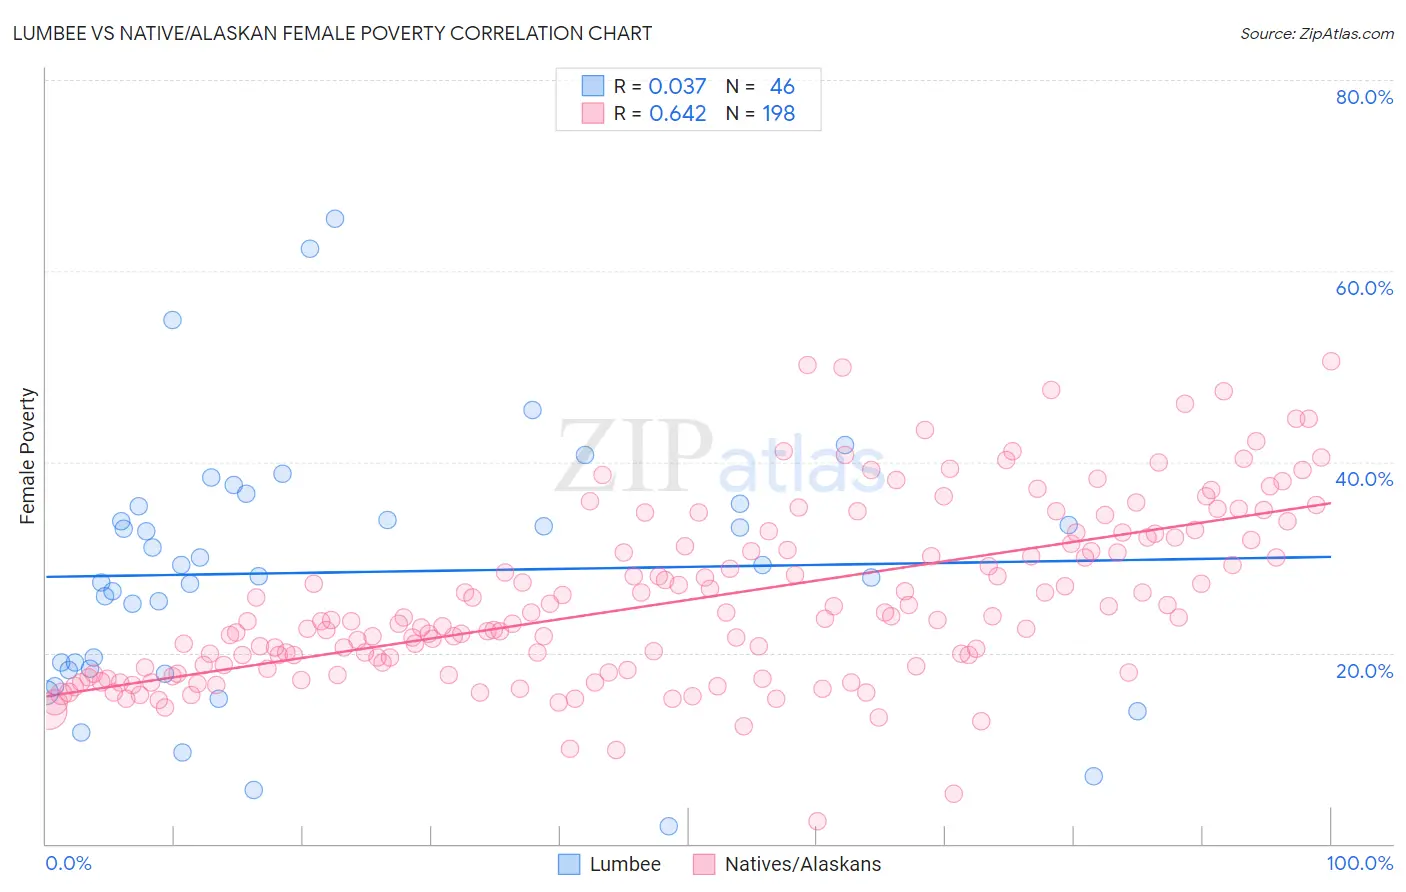
The statistical analysis conducted on geographies consisting of 92,256,229 people shows no correlation between the proportion of Lumbee and poverty level among females in the United States with a correlation coefficient (R) of 0.037 and weighted average of 23.5%. Similarly, the statistical analysis conducted on geographies consisting of 512,476,258 people shows a significant positive correlation between the proportion of Natives/Alaskans and poverty level among females in the United States with a correlation coefficient (R) of 0.642 and weighted average of 19.2%, a difference of 22.5%.
Female Poverty Correlation Summary
| Measurement | Lumbee | Native/Alaskan |
| Minimum | 1.9% | 2.3% |
| Maximum | 65.5% | 50.5% |
| Range | 63.6% | 48.2% |
| Mean | 28.4% | 25.5% |
| Median | 28.6% | 23.5% |
| Interquartile 25% (IQ1) | 18.3% | 18.3% |
| Interquartile 75% (IQ3) | 35.3% | 31.8% |
| Interquartile Range (IQR) | 17.0% | 13.5% |
| Standard Deviation (Sample) | 13.4% | 9.2% |
| Standard Deviation (Population) | 13.3% | 9.1% |
Demographics Similar to Lumbee and Natives/Alaskans by Female Poverty
In terms of female poverty, the demographic groups most similar to Lumbee are Pima (23.6%, a difference of 0.31%), Navajo (23.9%, a difference of 1.6%), Immigrants from Yemen (22.8%, a difference of 3.0%), Crow (22.1%, a difference of 6.2%), and Puerto Rican (25.2%, a difference of 7.1%). Similarly, the demographic groups most similar to Natives/Alaskans are Apache (19.2%, a difference of 0.16%), Dominican (19.1%, a difference of 0.42%), Immigrants from Dominican Republic (19.3%, a difference of 0.76%), Kiowa (18.6%, a difference of 3.2%), and Black/African American (18.6%, a difference of 3.3%).
| Demographics | Rating | Rank | Female Poverty |
| Yakama | 0.0 /100 | #327 | Tragic 18.0% |
| Blacks/African Americans | 0.0 /100 | #328 | Tragic 18.6% |
| Kiowa | 0.0 /100 | #329 | Tragic 18.6% |
| Dominicans | 0.0 /100 | #330 | Tragic 19.1% |
| Natives/Alaskans | 0.0 /100 | #331 | Tragic 19.2% |
| Apache | 0.0 /100 | #332 | Tragic 19.2% |
| Immigrants | Dominican Republic | 0.0 /100 | #333 | Tragic 19.3% |
| Houma | 0.0 /100 | #334 | Tragic 20.0% |
| Cheyenne | 0.0 /100 | #335 | Tragic 20.2% |
| Pueblo | 0.0 /100 | #336 | Tragic 20.7% |
| Yuman | 0.0 /100 | #337 | Tragic 20.8% |
| Sioux | 0.0 /100 | #338 | Tragic 20.9% |
| Hopi | 0.0 /100 | #339 | Tragic 21.0% |
| Yup'ik | 0.0 /100 | #340 | Tragic 21.5% |
| Crow | 0.0 /100 | #341 | Tragic 22.1% |
| Immigrants | Yemen | 0.0 /100 | #342 | Tragic 22.8% |
| Lumbee | 0.0 /100 | #343 | Tragic 23.5% |
| Pima | 0.0 /100 | #344 | Tragic 23.6% |
| Navajo | 0.0 /100 | #345 | Tragic 23.9% |
| Puerto Ricans | 0.0 /100 | #346 | Tragic 25.2% |
| Tohono O'odham | 0.0 /100 | #347 | Tragic 25.9% |