Cherokee vs Moroccan Female Poverty
COMPARE
Cherokee
Moroccan
Female Poverty
Female Poverty Comparison
Cherokee
Moroccans
15.6%
FEMALE POVERTY
0.1/ 100
METRIC RATING
263rd/ 347
METRIC RANK
14.3%
FEMALE POVERTY
7.2/ 100
METRIC RATING
211th/ 347
METRIC RANK
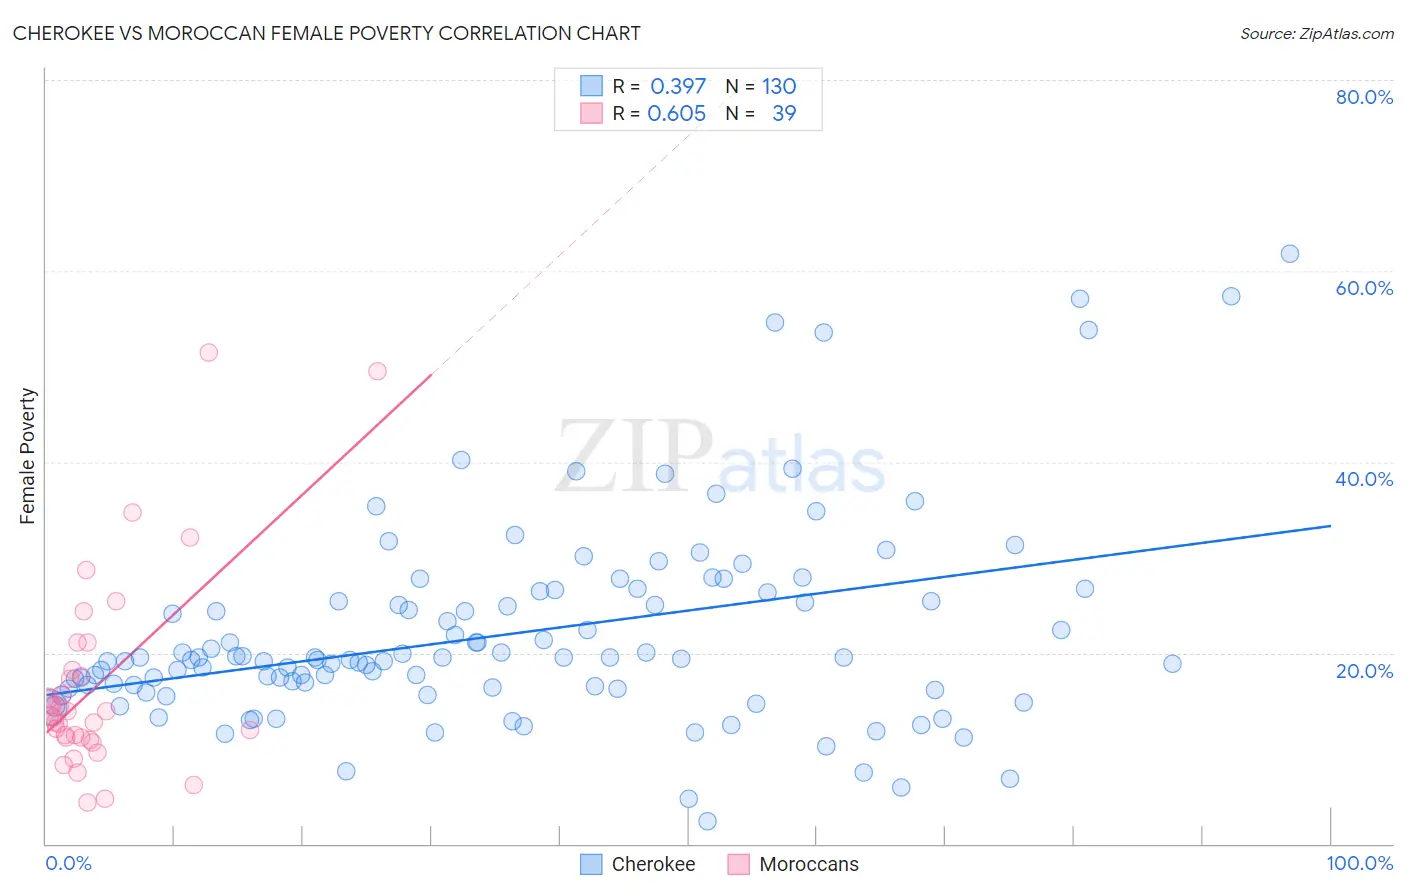
Cherokee vs Moroccan Female Poverty Correlation Chart
The statistical analysis conducted on geographies consisting of 493,220,722 people shows a mild positive correlation between the proportion of Cherokee and poverty level among females in the United States with a correlation coefficient (R) of 0.397 and weighted average of 15.6%. Similarly, the statistical analysis conducted on geographies consisting of 201,724,575 people shows a significant positive correlation between the proportion of Moroccans and poverty level among females in the United States with a correlation coefficient (R) of 0.605 and weighted average of 14.3%, a difference of 9.4%.
Female Poverty Correlation Summary
| Measurement | Cherokee | Moroccan |
| Minimum | 2.3% | 4.4% |
| Maximum | 61.8% | 51.5% |
| Range | 59.5% | 47.1% |
| Mean | 21.9% | 16.6% |
| Median | 19.3% | 13.4% |
| Interquartile 25% (IQ1) | 16.3% | 11.1% |
| Interquartile 75% (IQ3) | 25.5% | 18.2% |
| Interquartile Range (IQR) | 9.2% | 7.1% |
| Standard Deviation (Sample) | 10.5% | 10.5% |
| Standard Deviation (Population) | 10.5% | 10.4% |
Similar Demographics by Female Poverty
Demographics Similar to Cherokee by Female Poverty
In terms of female poverty, the demographic groups most similar to Cherokee are Guyanese (15.6%, a difference of 0.010%), Mexican American Indian (15.6%, a difference of 0.010%), Immigrants from Guyana (15.6%, a difference of 0.11%), Immigrants from Ecuador (15.6%, a difference of 0.13%), and Cape Verdean (15.6%, a difference of 0.19%).
| Demographics | Rating | Rank | Female Poverty |
| Jamaicans | 0.2 /100 | #256 | Tragic 15.5% |
| Immigrants | Jamaica | 0.1 /100 | #257 | Tragic 15.6% |
| Shoshone | 0.1 /100 | #258 | Tragic 15.6% |
| Cape Verdeans | 0.1 /100 | #259 | Tragic 15.6% |
| Immigrants | Guyana | 0.1 /100 | #260 | Tragic 15.6% |
| Guyanese | 0.1 /100 | #261 | Tragic 15.6% |
| Mexican American Indians | 0.1 /100 | #262 | Tragic 15.6% |
| Cherokee | 0.1 /100 | #263 | Tragic 15.6% |
| Immigrants | Ecuador | 0.1 /100 | #264 | Tragic 15.6% |
| Immigrants | Liberia | 0.1 /100 | #265 | Tragic 15.7% |
| Immigrants | El Salvador | 0.1 /100 | #266 | Tragic 15.7% |
| Sub-Saharan Africans | 0.1 /100 | #267 | Tragic 15.8% |
| Immigrants | Nicaragua | 0.1 /100 | #268 | Tragic 15.8% |
| Iroquois | 0.1 /100 | #269 | Tragic 15.8% |
| Chickasaw | 0.1 /100 | #270 | Tragic 15.9% |
Demographics Similar to Moroccans by Female Poverty
In terms of female poverty, the demographic groups most similar to Moroccans are Malaysian (14.3%, a difference of 0.080%), Panamanian (14.2%, a difference of 0.17%), Immigrants from the Azores (14.2%, a difference of 0.23%), Immigrants from Eastern Africa (14.2%, a difference of 0.58%), and Bermudan (14.4%, a difference of 0.63%).
| Demographics | Rating | Rank | Female Poverty |
| Spaniards | 18.9 /100 | #204 | Poor 13.9% |
| Ugandans | 15.4 /100 | #205 | Poor 14.0% |
| Immigrants | Uruguay | 14.0 /100 | #206 | Poor 14.0% |
| Immigrants | Eastern Africa | 9.0 /100 | #207 | Tragic 14.2% |
| Immigrants | Azores | 7.9 /100 | #208 | Tragic 14.2% |
| Panamanians | 7.7 /100 | #209 | Tragic 14.2% |
| Malaysians | 7.4 /100 | #210 | Tragic 14.3% |
| Moroccans | 7.2 /100 | #211 | Tragic 14.3% |
| Bermudans | 5.5 /100 | #212 | Tragic 14.4% |
| Alaskan Athabascans | 5.3 /100 | #213 | Tragic 14.4% |
| Marshallese | 5.0 /100 | #214 | Tragic 14.4% |
| Immigrants | Panama | 4.7 /100 | #215 | Tragic 14.4% |
| Immigrants | Thailand | 4.5 /100 | #216 | Tragic 14.4% |
| Immigrants | Immigrants | 4.5 /100 | #217 | Tragic 14.4% |
| Immigrants | Uzbekistan | 4.4 /100 | #218 | Tragic 14.4% |