Lumbee vs Egyptian Female Poverty
COMPARE
Lumbee
Egyptian
Female Poverty
Female Poverty Comparison
Lumbee
Egyptians
23.5%
FEMALE POVERTY
0.0/ 100
METRIC RATING
343rd/ 347
METRIC RANK
12.3%
FEMALE POVERTY
97.2/ 100
METRIC RATING
78th/ 347
METRIC RANK
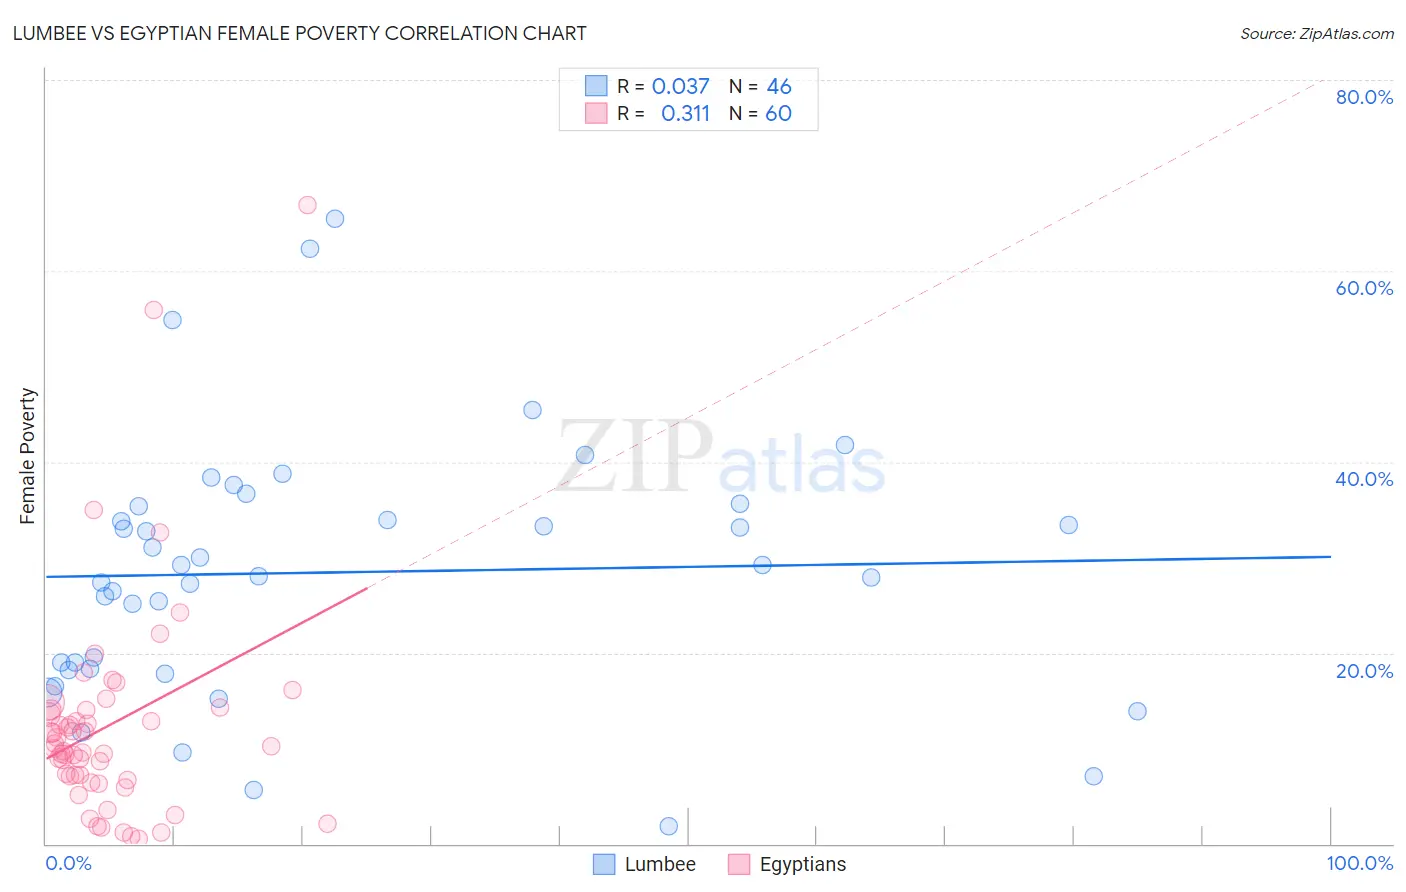
Lumbee vs Egyptian Female Poverty Correlation Chart
The statistical analysis conducted on geographies consisting of 92,256,229 people shows no correlation between the proportion of Lumbee and poverty level among females in the United States with a correlation coefficient (R) of 0.037 and weighted average of 23.5%. Similarly, the statistical analysis conducted on geographies consisting of 276,729,469 people shows a mild positive correlation between the proportion of Egyptians and poverty level among females in the United States with a correlation coefficient (R) of 0.311 and weighted average of 12.3%, a difference of 91.2%.
Female Poverty Correlation Summary
| Measurement | Lumbee | Egyptian |
| Minimum | 1.9% | 0.56% |
| Maximum | 65.5% | 66.9% |
| Range | 63.6% | 66.4% |
| Mean | 28.4% | 12.4% |
| Median | 28.6% | 10.1% |
| Interquartile 25% (IQ1) | 18.3% | 6.9% |
| Interquartile 75% (IQ3) | 35.3% | 14.0% |
| Interquartile Range (IQR) | 17.0% | 7.1% |
| Standard Deviation (Sample) | 13.4% | 11.5% |
| Standard Deviation (Population) | 13.3% | 11.4% |
Similar Demographics by Female Poverty
Demographics Similar to Lumbee by Female Poverty
In terms of female poverty, the demographic groups most similar to Lumbee are Pima (23.6%, a difference of 0.31%), Navajo (23.9%, a difference of 1.6%), Immigrants from Yemen (22.8%, a difference of 3.0%), Crow (22.1%, a difference of 6.2%), and Puerto Rican (25.2%, a difference of 7.1%).
| Demographics | Rating | Rank | Female Poverty |
| Immigrants | Dominican Republic | 0.0 /100 | #333 | Tragic 19.3% |
| Houma | 0.0 /100 | #334 | Tragic 20.0% |
| Cheyenne | 0.0 /100 | #335 | Tragic 20.2% |
| Pueblo | 0.0 /100 | #336 | Tragic 20.7% |
| Yuman | 0.0 /100 | #337 | Tragic 20.8% |
| Sioux | 0.0 /100 | #338 | Tragic 20.9% |
| Hopi | 0.0 /100 | #339 | Tragic 21.0% |
| Yup'ik | 0.0 /100 | #340 | Tragic 21.5% |
| Crow | 0.0 /100 | #341 | Tragic 22.1% |
| Immigrants | Yemen | 0.0 /100 | #342 | Tragic 22.8% |
| Lumbee | 0.0 /100 | #343 | Tragic 23.5% |
| Pima | 0.0 /100 | #344 | Tragic 23.6% |
| Navajo | 0.0 /100 | #345 | Tragic 23.9% |
| Puerto Ricans | 0.0 /100 | #346 | Tragic 25.2% |
| Tohono O'odham | 0.0 /100 | #347 | Tragic 25.9% |
Demographics Similar to Egyptians by Female Poverty
In terms of female poverty, the demographic groups most similar to Egyptians are Serbian (12.3%, a difference of 0.010%), Immigrants from Eastern Europe (12.3%, a difference of 0.040%), Immigrants from North America (12.3%, a difference of 0.070%), Slovak (12.3%, a difference of 0.12%), and Immigrants from Sweden (12.3%, a difference of 0.12%).
| Demographics | Rating | Rank | Female Poverty |
| Carpatho Rusyns | 97.6 /100 | #71 | Exceptional 12.2% |
| Cambodians | 97.5 /100 | #72 | Exceptional 12.2% |
| Zimbabweans | 97.5 /100 | #73 | Exceptional 12.3% |
| Immigrants | Canada | 97.5 /100 | #74 | Exceptional 12.3% |
| Europeans | 97.4 /100 | #75 | Exceptional 12.3% |
| Immigrants | Eastern Europe | 97.2 /100 | #76 | Exceptional 12.3% |
| Serbians | 97.2 /100 | #77 | Exceptional 12.3% |
| Egyptians | 97.2 /100 | #78 | Exceptional 12.3% |
| Immigrants | North America | 97.1 /100 | #79 | Exceptional 12.3% |
| Slovaks | 97.1 /100 | #80 | Exceptional 12.3% |
| Immigrants | Sweden | 97.1 /100 | #81 | Exceptional 12.3% |
| Jordanians | 97.1 /100 | #82 | Exceptional 12.3% |
| Immigrants | England | 96.9 /100 | #83 | Exceptional 12.3% |
| Northern Europeans | 96.6 /100 | #84 | Exceptional 12.4% |
| Irish | 96.5 /100 | #85 | Exceptional 12.4% |