Lumbee vs Immigrants from Belize Female Poverty
COMPARE
Lumbee
Immigrants from Belize
Female Poverty
Female Poverty Comparison
Lumbee
Immigrants from Belize
23.5%
FEMALE POVERTY
0.0/ 100
METRIC RATING
343rd/ 347
METRIC RANK
16.3%
FEMALE POVERTY
0.0/ 100
METRIC RATING
287th/ 347
METRIC RANK
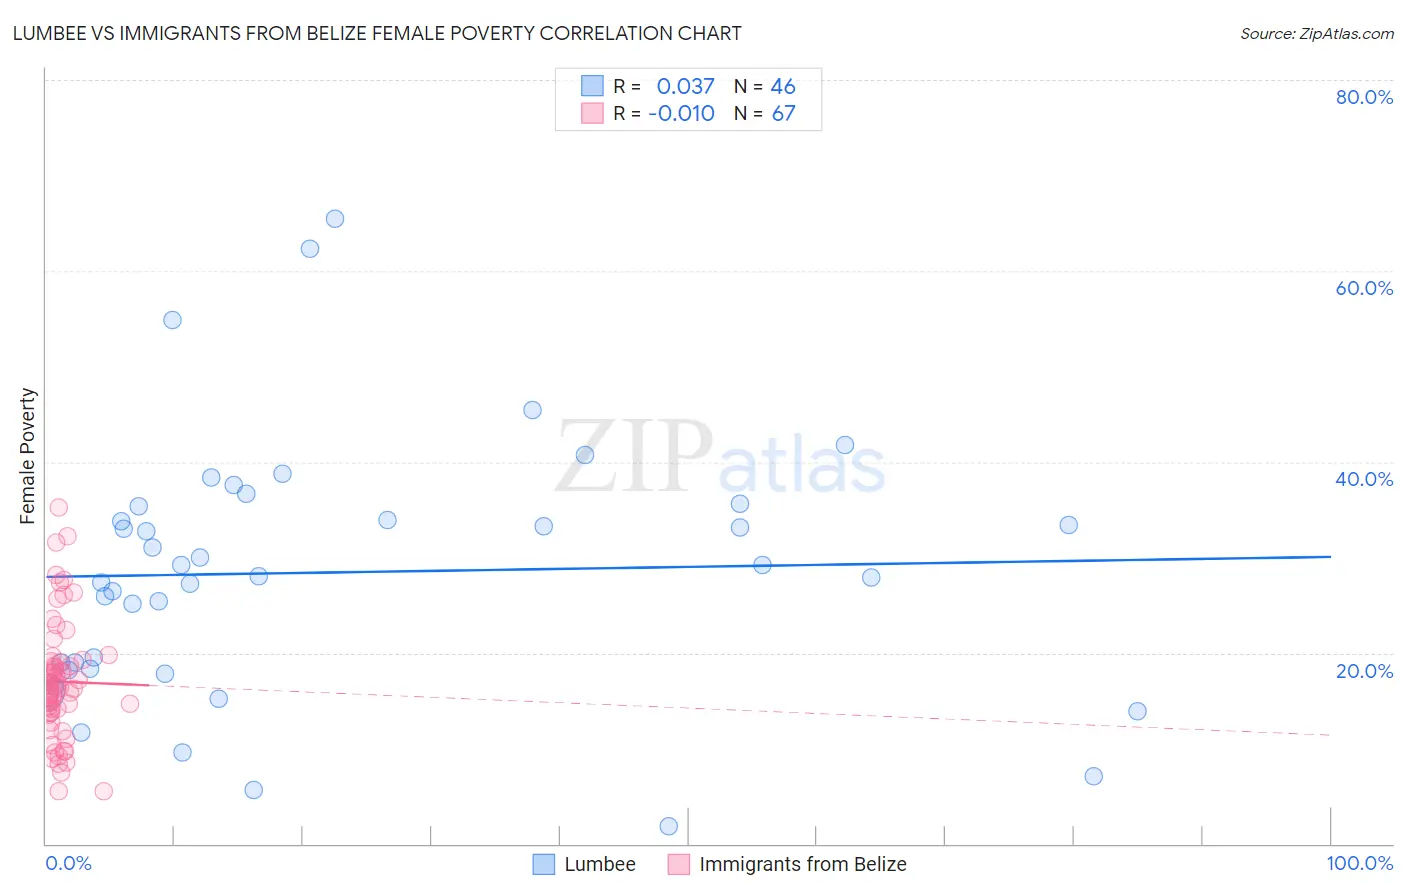
Lumbee vs Immigrants from Belize Female Poverty Correlation Chart
The statistical analysis conducted on geographies consisting of 92,256,229 people shows no correlation between the proportion of Lumbee and poverty level among females in the United States with a correlation coefficient (R) of 0.037 and weighted average of 23.5%. Similarly, the statistical analysis conducted on geographies consisting of 130,293,638 people shows no correlation between the proportion of Immigrants from Belize and poverty level among females in the United States with a correlation coefficient (R) of -0.010 and weighted average of 16.3%, a difference of 44.5%.
Female Poverty Correlation Summary
| Measurement | Lumbee | Immigrants from Belize |
| Minimum | 1.9% | 5.5% |
| Maximum | 65.5% | 35.2% |
| Range | 63.6% | 29.7% |
| Mean | 28.4% | 17.0% |
| Median | 28.6% | 16.3% |
| Interquartile 25% (IQ1) | 18.3% | 13.8% |
| Interquartile 75% (IQ3) | 35.3% | 19.1% |
| Interquartile Range (IQR) | 17.0% | 5.3% |
| Standard Deviation (Sample) | 13.4% | 6.2% |
| Standard Deviation (Population) | 13.3% | 6.2% |
Similar Demographics by Female Poverty
Demographics Similar to Lumbee by Female Poverty
In terms of female poverty, the demographic groups most similar to Lumbee are Pima (23.6%, a difference of 0.31%), Navajo (23.9%, a difference of 1.6%), Immigrants from Yemen (22.8%, a difference of 3.0%), Crow (22.1%, a difference of 6.2%), and Puerto Rican (25.2%, a difference of 7.1%).
| Demographics | Rating | Rank | Female Poverty |
| Immigrants | Dominican Republic | 0.0 /100 | #333 | Tragic 19.3% |
| Houma | 0.0 /100 | #334 | Tragic 20.0% |
| Cheyenne | 0.0 /100 | #335 | Tragic 20.2% |
| Pueblo | 0.0 /100 | #336 | Tragic 20.7% |
| Yuman | 0.0 /100 | #337 | Tragic 20.8% |
| Sioux | 0.0 /100 | #338 | Tragic 20.9% |
| Hopi | 0.0 /100 | #339 | Tragic 21.0% |
| Yup'ik | 0.0 /100 | #340 | Tragic 21.5% |
| Crow | 0.0 /100 | #341 | Tragic 22.1% |
| Immigrants | Yemen | 0.0 /100 | #342 | Tragic 22.8% |
| Lumbee | 0.0 /100 | #343 | Tragic 23.5% |
| Pima | 0.0 /100 | #344 | Tragic 23.6% |
| Navajo | 0.0 /100 | #345 | Tragic 23.9% |
| Puerto Ricans | 0.0 /100 | #346 | Tragic 25.2% |
| Tohono O'odham | 0.0 /100 | #347 | Tragic 25.9% |
Demographics Similar to Immigrants from Belize by Female Poverty
In terms of female poverty, the demographic groups most similar to Immigrants from Belize are Inupiat (16.2%, a difference of 0.19%), Indonesian (16.4%, a difference of 0.55%), Blackfeet (16.4%, a difference of 0.56%), Comanche (16.2%, a difference of 0.63%), and Spanish American (16.2%, a difference of 0.71%).
| Demographics | Rating | Rank | Female Poverty |
| Vietnamese | 0.0 /100 | #280 | Tragic 16.1% |
| West Indians | 0.0 /100 | #281 | Tragic 16.1% |
| Immigrants | Haiti | 0.0 /100 | #282 | Tragic 16.1% |
| Immigrants | Cuba | 0.0 /100 | #283 | Tragic 16.1% |
| Spanish Americans | 0.0 /100 | #284 | Tragic 16.2% |
| Comanche | 0.0 /100 | #285 | Tragic 16.2% |
| Inupiat | 0.0 /100 | #286 | Tragic 16.2% |
| Immigrants | Belize | 0.0 /100 | #287 | Tragic 16.3% |
| Indonesians | 0.0 /100 | #288 | Tragic 16.4% |
| Blackfeet | 0.0 /100 | #289 | Tragic 16.4% |
| Immigrants | Bangladesh | 0.0 /100 | #290 | Tragic 16.4% |
| Yaqui | 0.0 /100 | #291 | Tragic 16.4% |
| Immigrants | Zaire | 0.0 /100 | #292 | Tragic 16.4% |
| Immigrants | Latin America | 0.0 /100 | #293 | Tragic 16.4% |
| Immigrants | Cabo Verde | 0.0 /100 | #294 | Tragic 16.4% |