Lumbee vs Moroccan Single Father Poverty
COMPARE
Lumbee
Moroccan
Single Father Poverty
Single Father Poverty Comparison
Lumbee
Moroccans
28.5%
SINGLE FATHER POVERTY
0.0/ 100
METRIC RATING
343rd/ 347
METRIC RANK
17.0%
SINGLE FATHER POVERTY
2.1/ 100
METRIC RATING
242nd/ 347
METRIC RANK
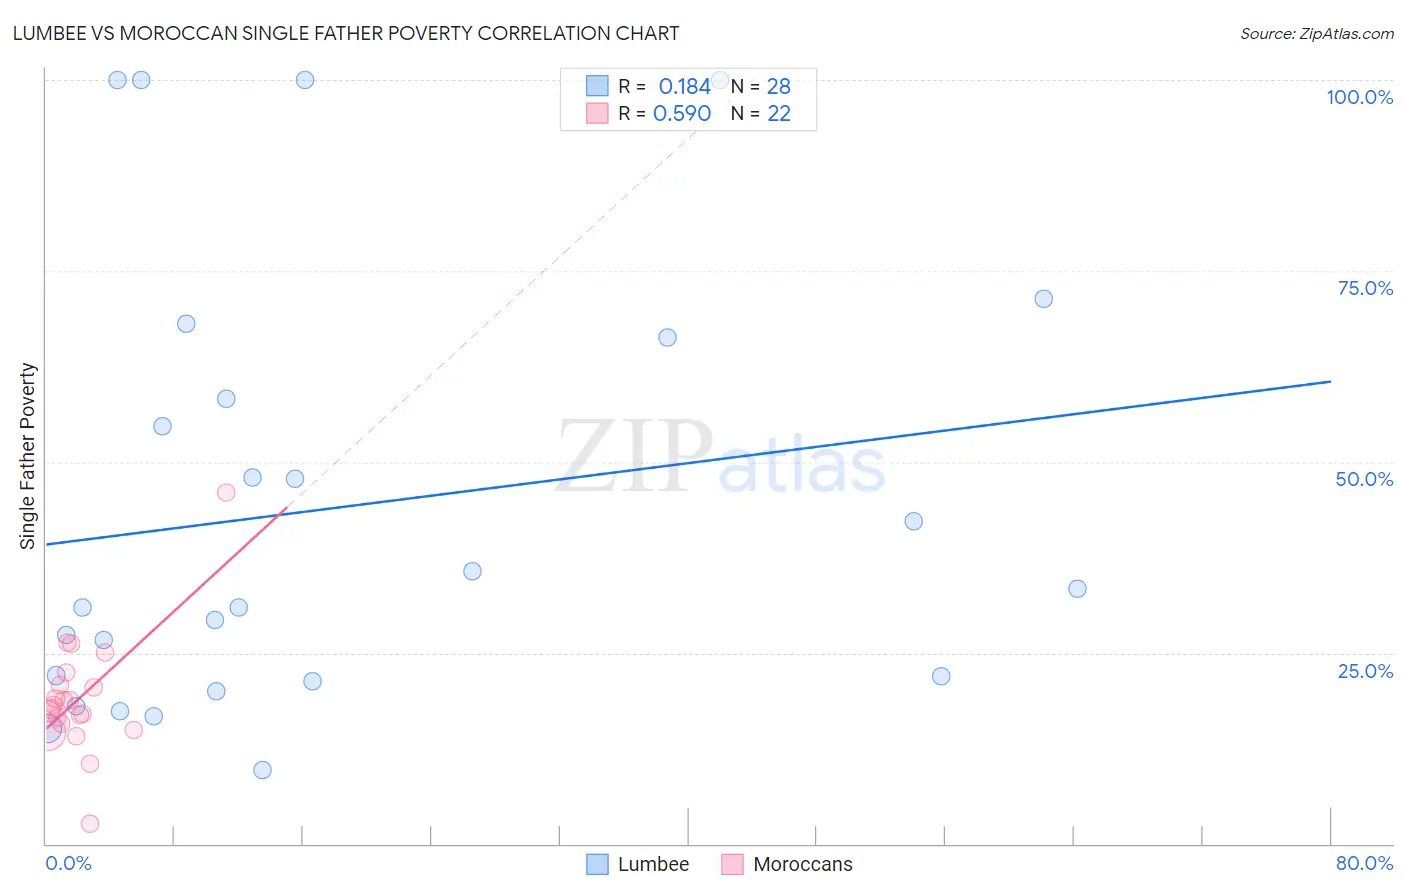
Lumbee vs Moroccan Single Father Poverty Correlation Chart
The statistical analysis conducted on geographies consisting of 83,517,726 people shows a poor positive correlation between the proportion of Lumbee and poverty level among single fathers in the United States with a correlation coefficient (R) of 0.184 and weighted average of 28.5%. Similarly, the statistical analysis conducted on geographies consisting of 173,540,722 people shows a substantial positive correlation between the proportion of Moroccans and poverty level among single fathers in the United States with a correlation coefficient (R) of 0.590 and weighted average of 17.0%, a difference of 67.7%.
Single Father Poverty Correlation Summary
| Measurement | Lumbee | Moroccan |
| Minimum | 9.7% | 2.6% |
| Maximum | 100.0% | 46.0% |
| Range | 90.3% | 43.4% |
| Mean | 44.0% | 19.1% |
| Median | 32.1% | 17.9% |
| Interquartile 25% (IQ1) | 21.6% | 15.7% |
| Interquartile 75% (IQ3) | 62.2% | 20.7% |
| Interquartile Range (IQR) | 40.6% | 5.0% |
| Standard Deviation (Sample) | 28.7% | 7.9% |
| Standard Deviation (Population) | 28.2% | 7.7% |
Similar Demographics by Single Father Poverty
Demographics Similar to Lumbee by Single Father Poverty
In terms of single father poverty, the demographic groups most similar to Lumbee are Yuman (28.4%, a difference of 0.33%), Navajo (29.2%, a difference of 2.6%), Hopi (27.2%, a difference of 4.9%), Crow (30.3%, a difference of 6.3%), and Houma (26.7%, a difference of 6.5%).
| Demographics | Rating | Rank | Single Father Poverty |
| Natives/Alaskans | 0.0 /100 | #333 | Tragic 22.4% |
| Kiowa | 0.0 /100 | #334 | Tragic 22.5% |
| Shoshone | 0.0 /100 | #335 | Tragic 22.9% |
| Cajuns | 0.0 /100 | #336 | Tragic 23.1% |
| Sioux | 0.0 /100 | #337 | Tragic 23.9% |
| Arapaho | 0.0 /100 | #338 | Tragic 24.0% |
| Apache | 0.0 /100 | #339 | Tragic 24.2% |
| Houma | 0.0 /100 | #340 | Tragic 26.7% |
| Hopi | 0.0 /100 | #341 | Tragic 27.2% |
| Yuman | 0.0 /100 | #342 | Tragic 28.4% |
| Lumbee | 0.0 /100 | #343 | Tragic 28.5% |
| Navajo | 0.0 /100 | #344 | Tragic 29.2% |
| Crow | 0.0 /100 | #345 | Tragic 30.3% |
| Puerto Ricans | 0.0 /100 | #346 | Tragic 31.5% |
| Yup'ik | 0.0 /100 | #347 | Tragic 32.5% |
Demographics Similar to Moroccans by Single Father Poverty
In terms of single father poverty, the demographic groups most similar to Moroccans are Czech (17.0%, a difference of 0.10%), Finnish (16.9%, a difference of 0.22%), Bermudan (16.9%, a difference of 0.23%), Immigrants from Saudi Arabia (16.9%, a difference of 0.25%), and Subsaharan African (16.9%, a difference of 0.32%).
| Demographics | Rating | Rank | Single Father Poverty |
| Immigrants | Western Europe | 2.9 /100 | #235 | Tragic 16.9% |
| Immigrants | Germany | 2.9 /100 | #236 | Tragic 16.9% |
| Sub-Saharan Africans | 2.9 /100 | #237 | Tragic 16.9% |
| Immigrants | Saudi Arabia | 2.7 /100 | #238 | Tragic 16.9% |
| Bermudans | 2.6 /100 | #239 | Tragic 16.9% |
| Finns | 2.6 /100 | #240 | Tragic 16.9% |
| Czechs | 2.3 /100 | #241 | Tragic 17.0% |
| Moroccans | 2.1 /100 | #242 | Tragic 17.0% |
| Immigrants | Cabo Verde | 1.6 /100 | #243 | Tragic 17.0% |
| Hondurans | 1.6 /100 | #244 | Tragic 17.0% |
| Trinidadians and Tobagonians | 1.5 /100 | #245 | Tragic 17.0% |
| Immigrants | Ireland | 1.4 /100 | #246 | Tragic 17.1% |
| Greeks | 1.3 /100 | #247 | Tragic 17.1% |
| Czechoslovakians | 1.3 /100 | #248 | Tragic 17.1% |
| Canadians | 1.3 /100 | #249 | Tragic 17.1% |