Hawaiian vs Moroccan Female Poverty
COMPARE
Hawaiian
Moroccan
Female Poverty
Female Poverty Comparison
Hawaiians
Moroccans
13.6%
FEMALE POVERTY
39.9/ 100
METRIC RATING
188th/ 347
METRIC RANK
14.3%
FEMALE POVERTY
7.2/ 100
METRIC RATING
211th/ 347
METRIC RANK
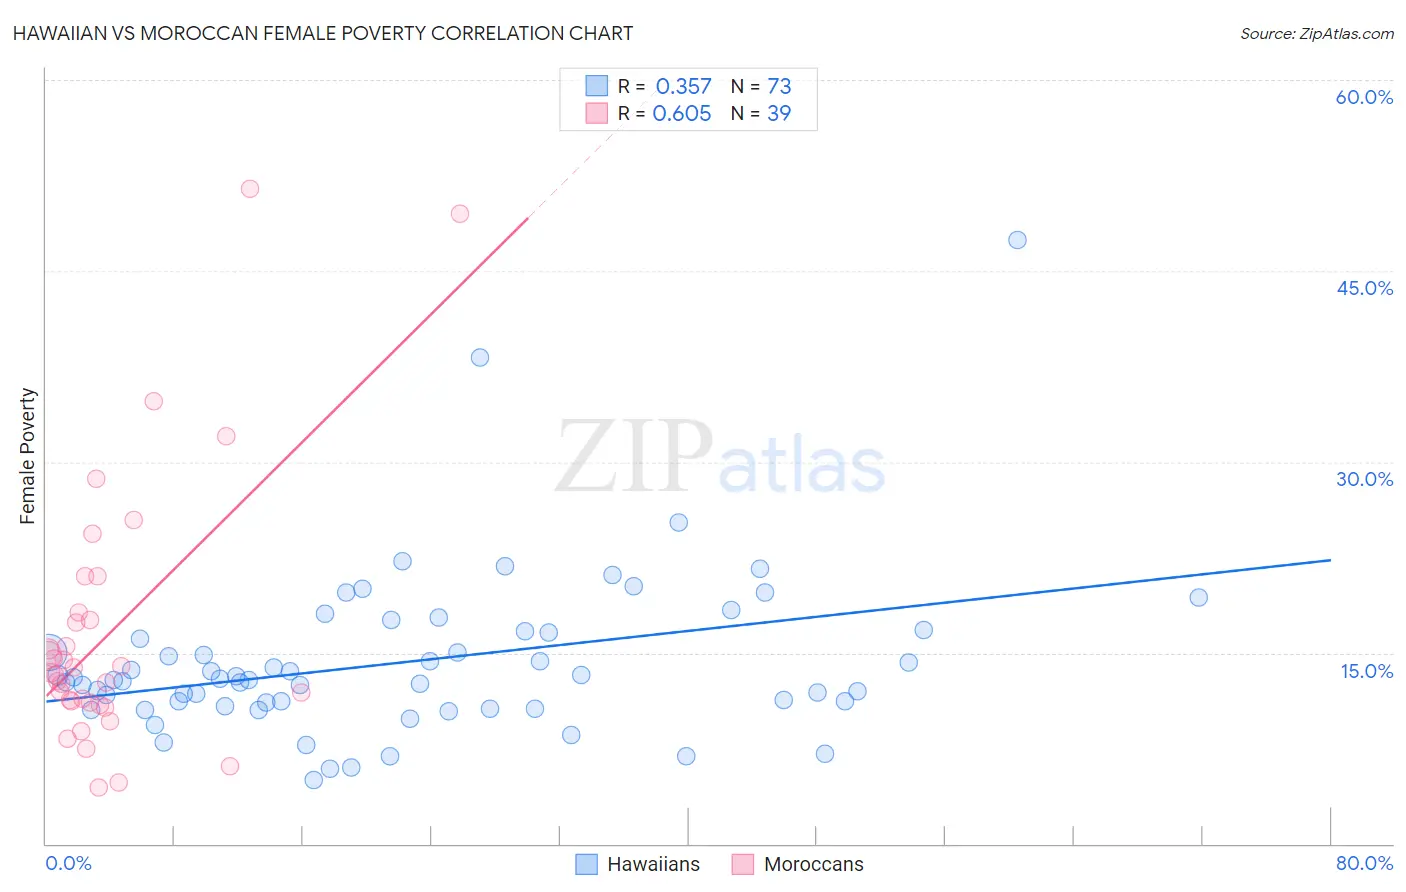
Hawaiian vs Moroccan Female Poverty Correlation Chart
The statistical analysis conducted on geographies consisting of 327,347,433 people shows a mild positive correlation between the proportion of Hawaiians and poverty level among females in the United States with a correlation coefficient (R) of 0.357 and weighted average of 13.6%. Similarly, the statistical analysis conducted on geographies consisting of 201,724,575 people shows a significant positive correlation between the proportion of Moroccans and poverty level among females in the United States with a correlation coefficient (R) of 0.605 and weighted average of 14.3%, a difference of 5.1%.
Female Poverty Correlation Summary
| Measurement | Hawaiian | Moroccan |
| Minimum | 5.0% | 4.4% |
| Maximum | 47.5% | 51.5% |
| Range | 42.5% | 47.1% |
| Mean | 14.3% | 16.6% |
| Median | 12.9% | 13.4% |
| Interquartile 25% (IQ1) | 11.0% | 11.1% |
| Interquartile 75% (IQ3) | 16.6% | 18.2% |
| Interquartile Range (IQR) | 5.7% | 7.1% |
| Standard Deviation (Sample) | 6.5% | 10.5% |
| Standard Deviation (Population) | 6.4% | 10.4% |
Similar Demographics by Female Poverty
Demographics Similar to Hawaiians by Female Poverty
In terms of female poverty, the demographic groups most similar to Hawaiians are Uruguayan (13.6%, a difference of 0.010%), Immigrants from Venezuela (13.6%, a difference of 0.11%), Immigrants from Portugal (13.6%, a difference of 0.16%), Immigrants from Cameroon (13.5%, a difference of 0.21%), and Immigrants from Sierra Leone (13.5%, a difference of 0.32%).
| Demographics | Rating | Rank | Female Poverty |
| Venezuelans | 44.5 /100 | #181 | Average 13.5% |
| Immigrants | Colombia | 44.5 /100 | #182 | Average 13.5% |
| Kenyans | 43.8 /100 | #183 | Average 13.5% |
| Immigrants | Sierra Leone | 43.2 /100 | #184 | Average 13.5% |
| Immigrants | Cameroon | 42.0 /100 | #185 | Average 13.5% |
| Immigrants | Portugal | 41.5 /100 | #186 | Average 13.6% |
| Immigrants | Venezuela | 41.0 /100 | #187 | Average 13.6% |
| Hawaiians | 39.9 /100 | #188 | Fair 13.6% |
| Uruguayans | 39.8 /100 | #189 | Fair 13.6% |
| Sierra Leoneans | 33.1 /100 | #190 | Fair 13.7% |
| Immigrants | Kuwait | 32.7 /100 | #191 | Fair 13.7% |
| Immigrants | Costa Rica | 31.9 /100 | #192 | Fair 13.7% |
| Iraqis | 31.8 /100 | #193 | Fair 13.7% |
| Delaware | 31.1 /100 | #194 | Fair 13.7% |
| Immigrants | South America | 30.6 /100 | #195 | Fair 13.7% |
Demographics Similar to Moroccans by Female Poverty
In terms of female poverty, the demographic groups most similar to Moroccans are Malaysian (14.3%, a difference of 0.080%), Panamanian (14.2%, a difference of 0.17%), Immigrants from the Azores (14.2%, a difference of 0.23%), Immigrants from Eastern Africa (14.2%, a difference of 0.58%), and Bermudan (14.4%, a difference of 0.63%).
| Demographics | Rating | Rank | Female Poverty |
| Spaniards | 18.9 /100 | #204 | Poor 13.9% |
| Ugandans | 15.4 /100 | #205 | Poor 14.0% |
| Immigrants | Uruguay | 14.0 /100 | #206 | Poor 14.0% |
| Immigrants | Eastern Africa | 9.0 /100 | #207 | Tragic 14.2% |
| Immigrants | Azores | 7.9 /100 | #208 | Tragic 14.2% |
| Panamanians | 7.7 /100 | #209 | Tragic 14.2% |
| Malaysians | 7.4 /100 | #210 | Tragic 14.3% |
| Moroccans | 7.2 /100 | #211 | Tragic 14.3% |
| Bermudans | 5.5 /100 | #212 | Tragic 14.4% |
| Alaskan Athabascans | 5.3 /100 | #213 | Tragic 14.4% |
| Marshallese | 5.0 /100 | #214 | Tragic 14.4% |
| Immigrants | Panama | 4.7 /100 | #215 | Tragic 14.4% |
| Immigrants | Thailand | 4.5 /100 | #216 | Tragic 14.4% |
| Immigrants | Immigrants | 4.5 /100 | #217 | Tragic 14.4% |
| Immigrants | Uzbekistan | 4.4 /100 | #218 | Tragic 14.4% |