Lumbee vs Immigrants from Nigeria Female Poverty
COMPARE
Lumbee
Immigrants from Nigeria
Female Poverty
Female Poverty Comparison
Lumbee
Immigrants from Nigeria
23.5%
FEMALE POVERTY
0.0/ 100
METRIC RATING
343rd/ 347
METRIC RANK
14.7%
FEMALE POVERTY
2.1/ 100
METRIC RATING
227th/ 347
METRIC RANK
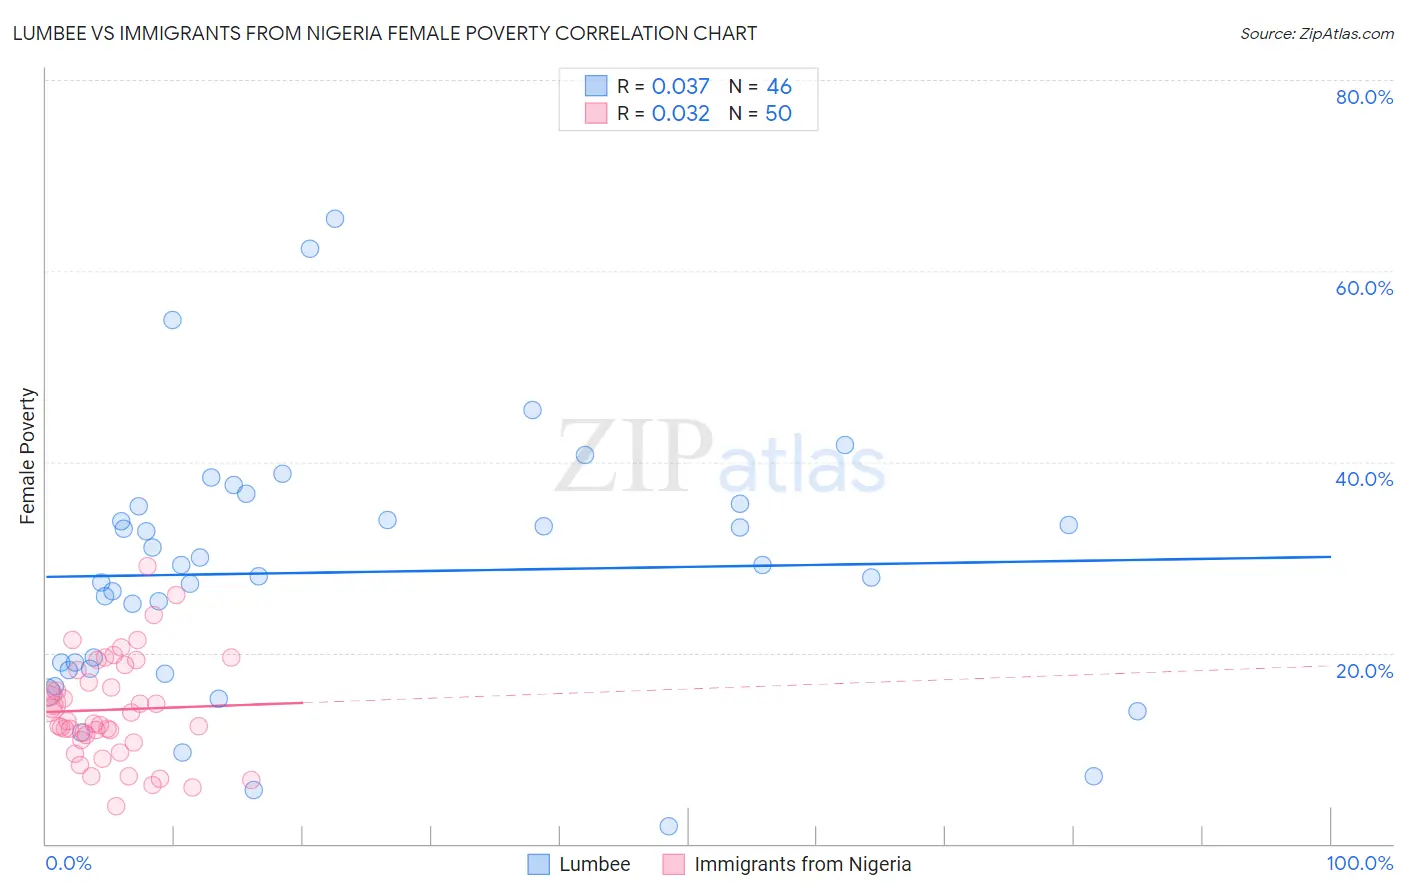
Lumbee vs Immigrants from Nigeria Female Poverty Correlation Chart
The statistical analysis conducted on geographies consisting of 92,256,229 people shows no correlation between the proportion of Lumbee and poverty level among females in the United States with a correlation coefficient (R) of 0.037 and weighted average of 23.5%. Similarly, the statistical analysis conducted on geographies consisting of 283,264,818 people shows no correlation between the proportion of Immigrants from Nigeria and poverty level among females in the United States with a correlation coefficient (R) of 0.032 and weighted average of 14.7%, a difference of 60.1%.
Female Poverty Correlation Summary
| Measurement | Lumbee | Immigrants from Nigeria |
| Minimum | 1.9% | 3.9% |
| Maximum | 65.5% | 29.1% |
| Range | 63.6% | 25.2% |
| Mean | 28.4% | 14.0% |
| Median | 28.6% | 12.7% |
| Interquartile 25% (IQ1) | 18.3% | 10.8% |
| Interquartile 75% (IQ3) | 35.3% | 18.2% |
| Interquartile Range (IQR) | 17.0% | 7.4% |
| Standard Deviation (Sample) | 13.4% | 5.4% |
| Standard Deviation (Population) | 13.3% | 5.4% |
Similar Demographics by Female Poverty
Demographics Similar to Lumbee by Female Poverty
In terms of female poverty, the demographic groups most similar to Lumbee are Pima (23.6%, a difference of 0.31%), Navajo (23.9%, a difference of 1.6%), Immigrants from Yemen (22.8%, a difference of 3.0%), Crow (22.1%, a difference of 6.2%), and Puerto Rican (25.2%, a difference of 7.1%).
| Demographics | Rating | Rank | Female Poverty |
| Immigrants | Dominican Republic | 0.0 /100 | #333 | Tragic 19.3% |
| Houma | 0.0 /100 | #334 | Tragic 20.0% |
| Cheyenne | 0.0 /100 | #335 | Tragic 20.2% |
| Pueblo | 0.0 /100 | #336 | Tragic 20.7% |
| Yuman | 0.0 /100 | #337 | Tragic 20.8% |
| Sioux | 0.0 /100 | #338 | Tragic 20.9% |
| Hopi | 0.0 /100 | #339 | Tragic 21.0% |
| Yup'ik | 0.0 /100 | #340 | Tragic 21.5% |
| Crow | 0.0 /100 | #341 | Tragic 22.1% |
| Immigrants | Yemen | 0.0 /100 | #342 | Tragic 22.8% |
| Lumbee | 0.0 /100 | #343 | Tragic 23.5% |
| Pima | 0.0 /100 | #344 | Tragic 23.6% |
| Navajo | 0.0 /100 | #345 | Tragic 23.9% |
| Puerto Ricans | 0.0 /100 | #346 | Tragic 25.2% |
| Tohono O'odham | 0.0 /100 | #347 | Tragic 25.9% |
Demographics Similar to Immigrants from Nigeria by Female Poverty
In terms of female poverty, the demographic groups most similar to Immigrants from Nigeria are German Russian (14.7%, a difference of 0.15%), Ghanaian (14.7%, a difference of 0.21%), Immigrants from Eritrea (14.6%, a difference of 0.31%), Alaska Native (14.7%, a difference of 0.41%), and Nigerian (14.8%, a difference of 0.51%).
| Demographics | Rating | Rank | Female Poverty |
| Alsatians | 4.0 /100 | #220 | Tragic 14.5% |
| Immigrants | Cambodia | 3.7 /100 | #221 | Tragic 14.5% |
| Immigrants | Nonimmigrants | 3.7 /100 | #222 | Tragic 14.5% |
| Immigrants | Africa | 3.3 /100 | #223 | Tragic 14.5% |
| Americans | 2.8 /100 | #224 | Tragic 14.6% |
| Immigrants | Micronesia | 2.8 /100 | #225 | Tragic 14.6% |
| Immigrants | Eritrea | 2.4 /100 | #226 | Tragic 14.6% |
| Immigrants | Nigeria | 2.1 /100 | #227 | Tragic 14.7% |
| German Russians | 2.0 /100 | #228 | Tragic 14.7% |
| Ghanaians | 1.9 /100 | #229 | Tragic 14.7% |
| Alaska Natives | 1.8 /100 | #230 | Tragic 14.7% |
| Nigerians | 1.7 /100 | #231 | Tragic 14.8% |
| Osage | 1.5 /100 | #232 | Tragic 14.8% |
| Immigrants | Saudi Arabia | 1.4 /100 | #233 | Tragic 14.8% |
| Fijians | 1.1 /100 | #234 | Tragic 14.9% |