Lumbee vs African Female Poverty
COMPARE
Lumbee
African
Female Poverty
Female Poverty Comparison
Lumbee
Africans
23.5%
FEMALE POVERTY
0.0/ 100
METRIC RATING
343rd/ 347
METRIC RANK
16.9%
FEMALE POVERTY
0.0/ 100
METRIC RATING
308th/ 347
METRIC RANK
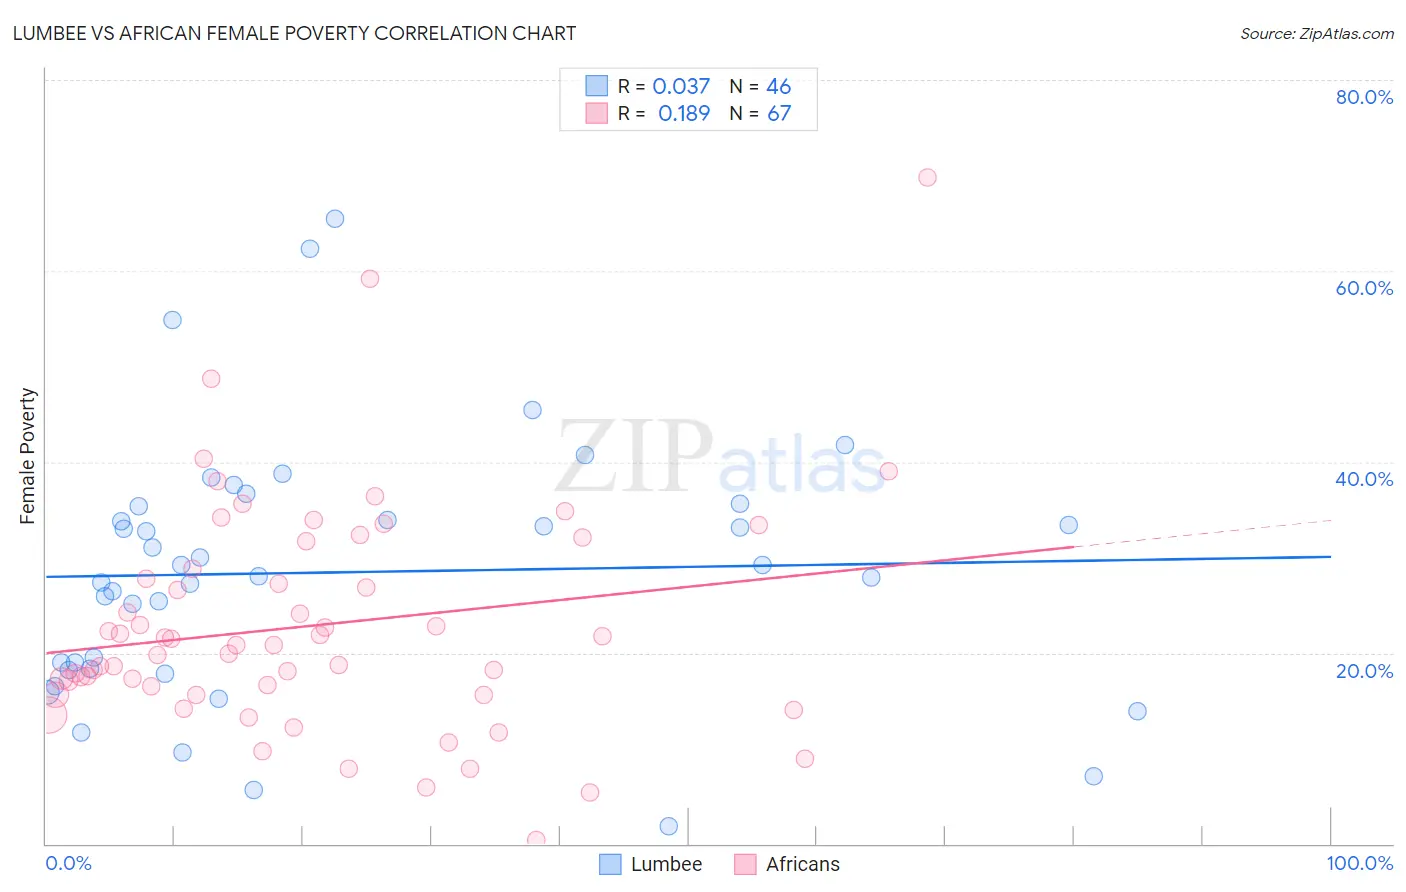
Lumbee vs African Female Poverty Correlation Chart
The statistical analysis conducted on geographies consisting of 92,256,229 people shows no correlation between the proportion of Lumbee and poverty level among females in the United States with a correlation coefficient (R) of 0.037 and weighted average of 23.5%. Similarly, the statistical analysis conducted on geographies consisting of 469,508,235 people shows a poor positive correlation between the proportion of Africans and poverty level among females in the United States with a correlation coefficient (R) of 0.189 and weighted average of 16.9%, a difference of 39.1%.
Female Poverty Correlation Summary
| Measurement | Lumbee | African |
| Minimum | 1.9% | 0.38% |
| Maximum | 65.5% | 69.8% |
| Range | 63.6% | 69.4% |
| Mean | 28.4% | 22.8% |
| Median | 28.6% | 20.8% |
| Interquartile 25% (IQ1) | 18.3% | 15.6% |
| Interquartile 75% (IQ3) | 35.3% | 28.8% |
| Interquartile Range (IQR) | 17.0% | 13.2% |
| Standard Deviation (Sample) | 13.4% | 12.0% |
| Standard Deviation (Population) | 13.3% | 11.9% |
Similar Demographics by Female Poverty
Demographics Similar to Lumbee by Female Poverty
In terms of female poverty, the demographic groups most similar to Lumbee are Pima (23.6%, a difference of 0.31%), Navajo (23.9%, a difference of 1.6%), Immigrants from Yemen (22.8%, a difference of 3.0%), Crow (22.1%, a difference of 6.2%), and Puerto Rican (25.2%, a difference of 7.1%).
| Demographics | Rating | Rank | Female Poverty |
| Immigrants | Dominican Republic | 0.0 /100 | #333 | Tragic 19.3% |
| Houma | 0.0 /100 | #334 | Tragic 20.0% |
| Cheyenne | 0.0 /100 | #335 | Tragic 20.2% |
| Pueblo | 0.0 /100 | #336 | Tragic 20.7% |
| Yuman | 0.0 /100 | #337 | Tragic 20.8% |
| Sioux | 0.0 /100 | #338 | Tragic 20.9% |
| Hopi | 0.0 /100 | #339 | Tragic 21.0% |
| Yup'ik | 0.0 /100 | #340 | Tragic 21.5% |
| Crow | 0.0 /100 | #341 | Tragic 22.1% |
| Immigrants | Yemen | 0.0 /100 | #342 | Tragic 22.8% |
| Lumbee | 0.0 /100 | #343 | Tragic 23.5% |
| Pima | 0.0 /100 | #344 | Tragic 23.6% |
| Navajo | 0.0 /100 | #345 | Tragic 23.9% |
| Puerto Ricans | 0.0 /100 | #346 | Tragic 25.2% |
| Tohono O'odham | 0.0 /100 | #347 | Tragic 25.9% |
Demographics Similar to Africans by Female Poverty
In terms of female poverty, the demographic groups most similar to Africans are Seminole (16.9%, a difference of 0.060%), Immigrants from Caribbean (16.9%, a difference of 0.19%), Immigrants from Mexico (17.0%, a difference of 0.39%), Immigrants from Grenada (16.8%, a difference of 0.45%), and Immigrants from Central America (16.8%, a difference of 0.46%).
| Demographics | Rating | Rank | Female Poverty |
| Guatemalans | 0.0 /100 | #301 | Tragic 16.7% |
| Chippewa | 0.0 /100 | #302 | Tragic 16.7% |
| Choctaw | 0.0 /100 | #303 | Tragic 16.8% |
| Immigrants | Central America | 0.0 /100 | #304 | Tragic 16.8% |
| Immigrants | Grenada | 0.0 /100 | #305 | Tragic 16.8% |
| Immigrants | Caribbean | 0.0 /100 | #306 | Tragic 16.9% |
| Seminole | 0.0 /100 | #307 | Tragic 16.9% |
| Africans | 0.0 /100 | #308 | Tragic 16.9% |
| Immigrants | Mexico | 0.0 /100 | #309 | Tragic 17.0% |
| Creek | 0.0 /100 | #310 | Tragic 17.0% |
| Immigrants | Guatemala | 0.0 /100 | #311 | Tragic 17.0% |
| Immigrants | Somalia | 0.0 /100 | #312 | Tragic 17.0% |
| British West Indians | 0.0 /100 | #313 | Tragic 17.0% |
| Dutch West Indians | 0.0 /100 | #314 | Tragic 17.1% |
| U.S. Virgin Islanders | 0.0 /100 | #315 | Tragic 17.3% |