Lumbee vs Immigrants from Vietnam Female Poverty
COMPARE
Lumbee
Immigrants from Vietnam
Female Poverty
Female Poverty Comparison
Lumbee
Immigrants from Vietnam
23.5%
FEMALE POVERTY
0.0/ 100
METRIC RATING
343rd/ 347
METRIC RANK
12.8%
FEMALE POVERTY
87.1/ 100
METRIC RATING
130th/ 347
METRIC RANK
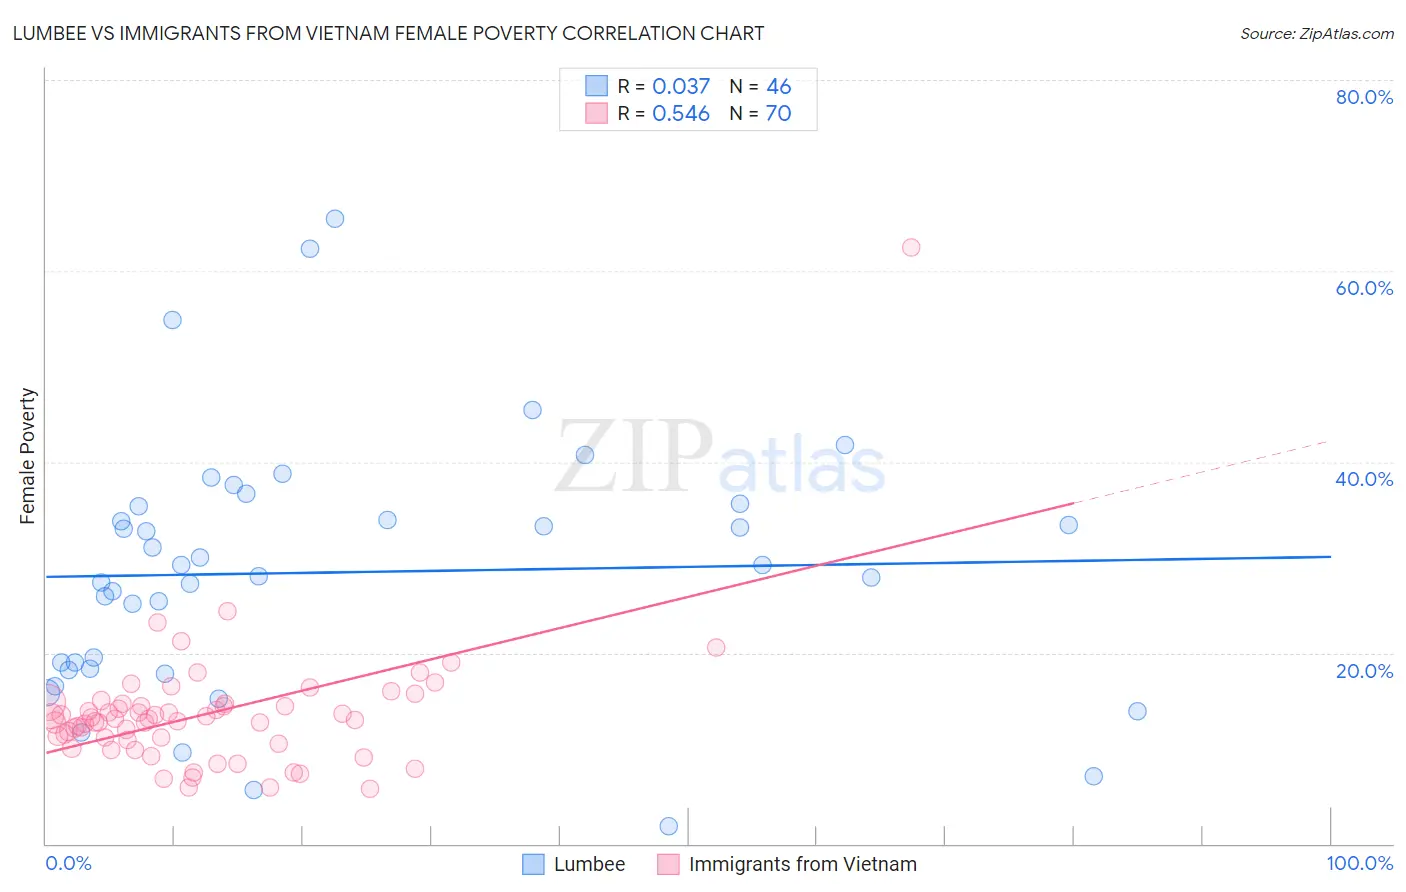
Lumbee vs Immigrants from Vietnam Female Poverty Correlation Chart
The statistical analysis conducted on geographies consisting of 92,256,229 people shows no correlation between the proportion of Lumbee and poverty level among females in the United States with a correlation coefficient (R) of 0.037 and weighted average of 23.5%. Similarly, the statistical analysis conducted on geographies consisting of 404,524,088 people shows a substantial positive correlation between the proportion of Immigrants from Vietnam and poverty level among females in the United States with a correlation coefficient (R) of 0.546 and weighted average of 12.8%, a difference of 83.3%.
Female Poverty Correlation Summary
| Measurement | Lumbee | Immigrants from Vietnam |
| Minimum | 1.9% | 5.8% |
| Maximum | 65.5% | 62.5% |
| Range | 63.6% | 56.7% |
| Mean | 28.4% | 13.6% |
| Median | 28.6% | 13.0% |
| Interquartile 25% (IQ1) | 18.3% | 10.8% |
| Interquartile 75% (IQ3) | 35.3% | 14.6% |
| Interquartile Range (IQR) | 17.0% | 3.8% |
| Standard Deviation (Sample) | 13.4% | 7.1% |
| Standard Deviation (Population) | 13.3% | 7.0% |
Similar Demographics by Female Poverty
Demographics Similar to Lumbee by Female Poverty
In terms of female poverty, the demographic groups most similar to Lumbee are Pima (23.6%, a difference of 0.31%), Navajo (23.9%, a difference of 1.6%), Immigrants from Yemen (22.8%, a difference of 3.0%), Crow (22.1%, a difference of 6.2%), and Puerto Rican (25.2%, a difference of 7.1%).
| Demographics | Rating | Rank | Female Poverty |
| Immigrants | Dominican Republic | 0.0 /100 | #333 | Tragic 19.3% |
| Houma | 0.0 /100 | #334 | Tragic 20.0% |
| Cheyenne | 0.0 /100 | #335 | Tragic 20.2% |
| Pueblo | 0.0 /100 | #336 | Tragic 20.7% |
| Yuman | 0.0 /100 | #337 | Tragic 20.8% |
| Sioux | 0.0 /100 | #338 | Tragic 20.9% |
| Hopi | 0.0 /100 | #339 | Tragic 21.0% |
| Yup'ik | 0.0 /100 | #340 | Tragic 21.5% |
| Crow | 0.0 /100 | #341 | Tragic 22.1% |
| Immigrants | Yemen | 0.0 /100 | #342 | Tragic 22.8% |
| Lumbee | 0.0 /100 | #343 | Tragic 23.5% |
| Pima | 0.0 /100 | #344 | Tragic 23.6% |
| Navajo | 0.0 /100 | #345 | Tragic 23.9% |
| Puerto Ricans | 0.0 /100 | #346 | Tragic 25.2% |
| Tohono O'odham | 0.0 /100 | #347 | Tragic 25.9% |
Demographics Similar to Immigrants from Vietnam by Female Poverty
In terms of female poverty, the demographic groups most similar to Immigrants from Vietnam are Immigrants from Argentina (12.8%, a difference of 0.030%), Immigrants from Jordan (12.8%, a difference of 0.050%), Immigrants from Western Europe (12.8%, a difference of 0.11%), Immigrants from Brazil (12.8%, a difference of 0.19%), and Immigrants from Belarus (12.8%, a difference of 0.27%).
| Demographics | Rating | Rank | Female Poverty |
| Immigrants | South Eastern Asia | 89.9 /100 | #123 | Excellent 12.7% |
| Immigrants | Norway | 89.3 /100 | #124 | Excellent 12.8% |
| Argentineans | 89.1 /100 | #125 | Excellent 12.8% |
| Immigrants | Ukraine | 88.8 /100 | #126 | Excellent 12.8% |
| South Africans | 88.4 /100 | #127 | Excellent 12.8% |
| Immigrants | Belarus | 88.2 /100 | #128 | Excellent 12.8% |
| Immigrants | Brazil | 87.9 /100 | #129 | Excellent 12.8% |
| Immigrants | Vietnam | 87.1 /100 | #130 | Excellent 12.8% |
| Immigrants | Argentina | 87.0 /100 | #131 | Excellent 12.8% |
| Immigrants | Jordan | 86.9 /100 | #132 | Excellent 12.8% |
| Immigrants | Western Europe | 86.6 /100 | #133 | Excellent 12.8% |
| Immigrants | Switzerland | 85.8 /100 | #134 | Excellent 12.9% |
| French | 85.6 /100 | #135 | Excellent 12.9% |
| Peruvians | 85.2 /100 | #136 | Excellent 12.9% |
| Chileans | 84.7 /100 | #137 | Excellent 12.9% |