Immigrants from Belize vs African Female Poverty
COMPARE
Immigrants from Belize
African
Female Poverty
Female Poverty Comparison
Immigrants from Belize
Africans
16.3%
FEMALE POVERTY
0.0/ 100
METRIC RATING
287th/ 347
METRIC RANK
16.9%
FEMALE POVERTY
0.0/ 100
METRIC RATING
308th/ 347
METRIC RANK
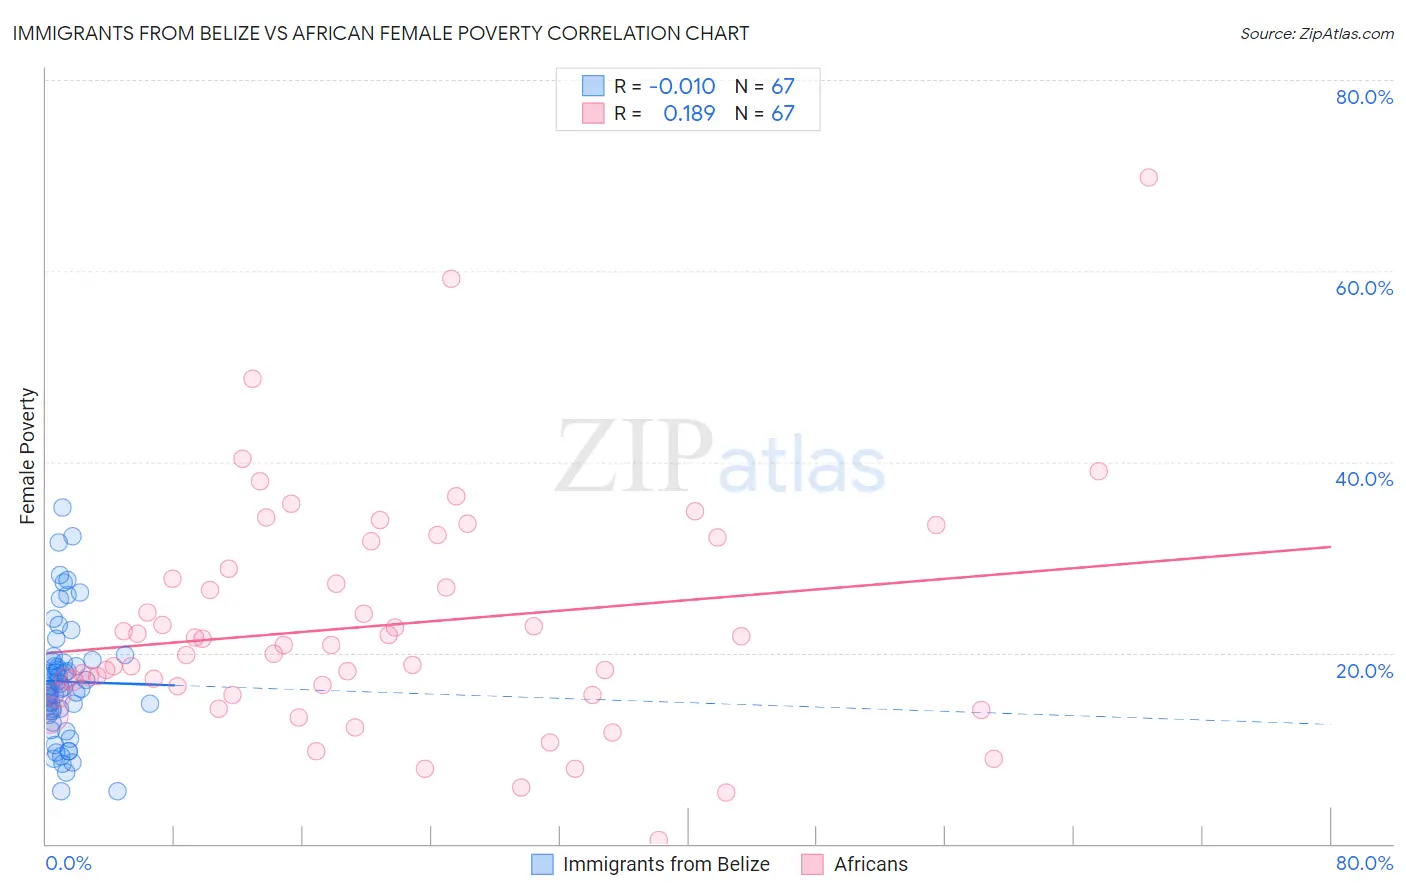
Immigrants from Belize vs African Female Poverty Correlation Chart
The statistical analysis conducted on geographies consisting of 130,293,638 people shows no correlation between the proportion of Immigrants from Belize and poverty level among females in the United States with a correlation coefficient (R) of -0.010 and weighted average of 16.3%. Similarly, the statistical analysis conducted on geographies consisting of 469,508,235 people shows a poor positive correlation between the proportion of Africans and poverty level among females in the United States with a correlation coefficient (R) of 0.189 and weighted average of 16.9%, a difference of 3.8%.
Female Poverty Correlation Summary
| Measurement | Immigrants from Belize | African |
| Minimum | 5.5% | 0.38% |
| Maximum | 35.2% | 69.8% |
| Range | 29.7% | 69.4% |
| Mean | 17.0% | 22.8% |
| Median | 16.3% | 20.8% |
| Interquartile 25% (IQ1) | 13.8% | 15.6% |
| Interquartile 75% (IQ3) | 19.1% | 28.8% |
| Interquartile Range (IQR) | 5.3% | 13.2% |
| Standard Deviation (Sample) | 6.2% | 12.0% |
| Standard Deviation (Population) | 6.2% | 11.9% |
Similar Demographics by Female Poverty
Demographics Similar to Immigrants from Belize by Female Poverty
In terms of female poverty, the demographic groups most similar to Immigrants from Belize are Inupiat (16.2%, a difference of 0.19%), Indonesian (16.4%, a difference of 0.55%), Blackfeet (16.4%, a difference of 0.56%), Comanche (16.2%, a difference of 0.63%), and Spanish American (16.2%, a difference of 0.71%).
| Demographics | Rating | Rank | Female Poverty |
| Vietnamese | 0.0 /100 | #280 | Tragic 16.1% |
| West Indians | 0.0 /100 | #281 | Tragic 16.1% |
| Immigrants | Haiti | 0.0 /100 | #282 | Tragic 16.1% |
| Immigrants | Cuba | 0.0 /100 | #283 | Tragic 16.1% |
| Spanish Americans | 0.0 /100 | #284 | Tragic 16.2% |
| Comanche | 0.0 /100 | #285 | Tragic 16.2% |
| Inupiat | 0.0 /100 | #286 | Tragic 16.2% |
| Immigrants | Belize | 0.0 /100 | #287 | Tragic 16.3% |
| Indonesians | 0.0 /100 | #288 | Tragic 16.4% |
| Blackfeet | 0.0 /100 | #289 | Tragic 16.4% |
| Immigrants | Bangladesh | 0.0 /100 | #290 | Tragic 16.4% |
| Yaqui | 0.0 /100 | #291 | Tragic 16.4% |
| Immigrants | Zaire | 0.0 /100 | #292 | Tragic 16.4% |
| Immigrants | Latin America | 0.0 /100 | #293 | Tragic 16.4% |
| Immigrants | Cabo Verde | 0.0 /100 | #294 | Tragic 16.4% |
Demographics Similar to Africans by Female Poverty
In terms of female poverty, the demographic groups most similar to Africans are Seminole (16.9%, a difference of 0.060%), Immigrants from Caribbean (16.9%, a difference of 0.19%), Immigrants from Mexico (17.0%, a difference of 0.39%), Immigrants from Grenada (16.8%, a difference of 0.45%), and Immigrants from Central America (16.8%, a difference of 0.46%).
| Demographics | Rating | Rank | Female Poverty |
| Guatemalans | 0.0 /100 | #301 | Tragic 16.7% |
| Chippewa | 0.0 /100 | #302 | Tragic 16.7% |
| Choctaw | 0.0 /100 | #303 | Tragic 16.8% |
| Immigrants | Central America | 0.0 /100 | #304 | Tragic 16.8% |
| Immigrants | Grenada | 0.0 /100 | #305 | Tragic 16.8% |
| Immigrants | Caribbean | 0.0 /100 | #306 | Tragic 16.9% |
| Seminole | 0.0 /100 | #307 | Tragic 16.9% |
| Africans | 0.0 /100 | #308 | Tragic 16.9% |
| Immigrants | Mexico | 0.0 /100 | #309 | Tragic 17.0% |
| Creek | 0.0 /100 | #310 | Tragic 17.0% |
| Immigrants | Guatemala | 0.0 /100 | #311 | Tragic 17.0% |
| Immigrants | Somalia | 0.0 /100 | #312 | Tragic 17.0% |
| British West Indians | 0.0 /100 | #313 | Tragic 17.0% |
| Dutch West Indians | 0.0 /100 | #314 | Tragic 17.1% |
| U.S. Virgin Islanders | 0.0 /100 | #315 | Tragic 17.3% |