Swiss vs African Female Poverty
COMPARE
Swiss
African
Female Poverty
Female Poverty Comparison
Swiss
Africans
12.2%
FEMALE POVERTY
97.7/ 100
METRIC RATING
69th/ 347
METRIC RANK
16.9%
FEMALE POVERTY
0.0/ 100
METRIC RATING
308th/ 347
METRIC RANK
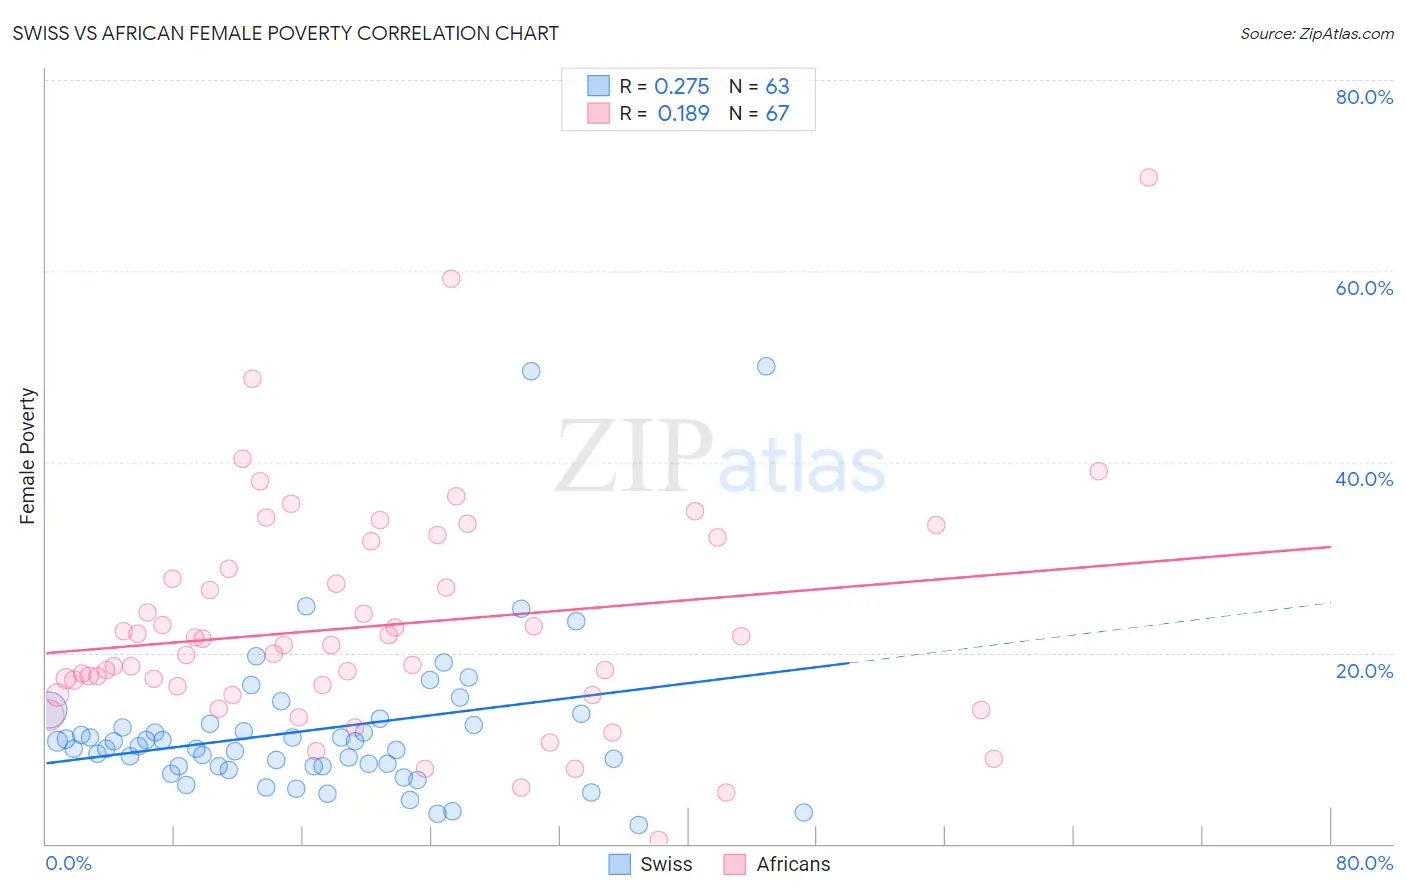
Swiss vs African Female Poverty Correlation Chart
The statistical analysis conducted on geographies consisting of 464,552,447 people shows a weak positive correlation between the proportion of Swiss and poverty level among females in the United States with a correlation coefficient (R) of 0.275 and weighted average of 12.2%. Similarly, the statistical analysis conducted on geographies consisting of 469,508,235 people shows a poor positive correlation between the proportion of Africans and poverty level among females in the United States with a correlation coefficient (R) of 0.189 and weighted average of 16.9%, a difference of 38.2%.
Female Poverty Correlation Summary
| Measurement | Swiss | African |
| Minimum | 1.9% | 0.38% |
| Maximum | 50.0% | 69.8% |
| Range | 48.1% | 69.4% |
| Mean | 11.9% | 22.8% |
| Median | 10.2% | 20.8% |
| Interquartile 25% (IQ1) | 8.1% | 15.6% |
| Interquartile 75% (IQ3) | 12.6% | 28.8% |
| Interquartile Range (IQR) | 4.5% | 13.2% |
| Standard Deviation (Sample) | 8.4% | 12.0% |
| Standard Deviation (Population) | 8.3% | 11.9% |
Similar Demographics by Female Poverty
Demographics Similar to Swiss by Female Poverty
In terms of female poverty, the demographic groups most similar to Swiss are Immigrants from Belgium (12.2%, a difference of 0.030%), Immigrants from Netherlands (12.2%, a difference of 0.10%), Immigrants from Eastern Asia (12.2%, a difference of 0.14%), Carpatho Rusyn (12.2%, a difference of 0.15%), and Cambodian (12.2%, a difference of 0.19%).
| Demographics | Rating | Rank | Female Poverty |
| Immigrants | Italy | 98.0 /100 | #62 | Exceptional 12.2% |
| Ukrainians | 98.0 /100 | #63 | Exceptional 12.2% |
| Germans | 98.0 /100 | #64 | Exceptional 12.2% |
| Indians (Asian) | 97.9 /100 | #65 | Exceptional 12.2% |
| Austrians | 97.9 /100 | #66 | Exceptional 12.2% |
| Immigrants | Eastern Asia | 97.8 /100 | #67 | Exceptional 12.2% |
| Immigrants | Netherlands | 97.8 /100 | #68 | Exceptional 12.2% |
| Swiss | 97.7 /100 | #69 | Exceptional 12.2% |
| Immigrants | Belgium | 97.7 /100 | #70 | Exceptional 12.2% |
| Carpatho Rusyns | 97.6 /100 | #71 | Exceptional 12.2% |
| Cambodians | 97.5 /100 | #72 | Exceptional 12.2% |
| Zimbabweans | 97.5 /100 | #73 | Exceptional 12.3% |
| Immigrants | Canada | 97.5 /100 | #74 | Exceptional 12.3% |
| Europeans | 97.4 /100 | #75 | Exceptional 12.3% |
| Immigrants | Eastern Europe | 97.2 /100 | #76 | Exceptional 12.3% |
Demographics Similar to Africans by Female Poverty
In terms of female poverty, the demographic groups most similar to Africans are Seminole (16.9%, a difference of 0.060%), Immigrants from Caribbean (16.9%, a difference of 0.19%), Immigrants from Mexico (17.0%, a difference of 0.39%), Immigrants from Grenada (16.8%, a difference of 0.45%), and Immigrants from Central America (16.8%, a difference of 0.46%).
| Demographics | Rating | Rank | Female Poverty |
| Guatemalans | 0.0 /100 | #301 | Tragic 16.7% |
| Chippewa | 0.0 /100 | #302 | Tragic 16.7% |
| Choctaw | 0.0 /100 | #303 | Tragic 16.8% |
| Immigrants | Central America | 0.0 /100 | #304 | Tragic 16.8% |
| Immigrants | Grenada | 0.0 /100 | #305 | Tragic 16.8% |
| Immigrants | Caribbean | 0.0 /100 | #306 | Tragic 16.9% |
| Seminole | 0.0 /100 | #307 | Tragic 16.9% |
| Africans | 0.0 /100 | #308 | Tragic 16.9% |
| Immigrants | Mexico | 0.0 /100 | #309 | Tragic 17.0% |
| Creek | 0.0 /100 | #310 | Tragic 17.0% |
| Immigrants | Guatemala | 0.0 /100 | #311 | Tragic 17.0% |
| Immigrants | Somalia | 0.0 /100 | #312 | Tragic 17.0% |
| British West Indians | 0.0 /100 | #313 | Tragic 17.0% |
| Dutch West Indians | 0.0 /100 | #314 | Tragic 17.1% |
| U.S. Virgin Islanders | 0.0 /100 | #315 | Tragic 17.3% |