Pueblo vs African Female Poverty
COMPARE
Pueblo
African
Female Poverty
Female Poverty Comparison
Pueblo
Africans
20.7%
FEMALE POVERTY
0.0/ 100
METRIC RATING
336th/ 347
METRIC RANK
16.9%
FEMALE POVERTY
0.0/ 100
METRIC RATING
308th/ 347
METRIC RANK
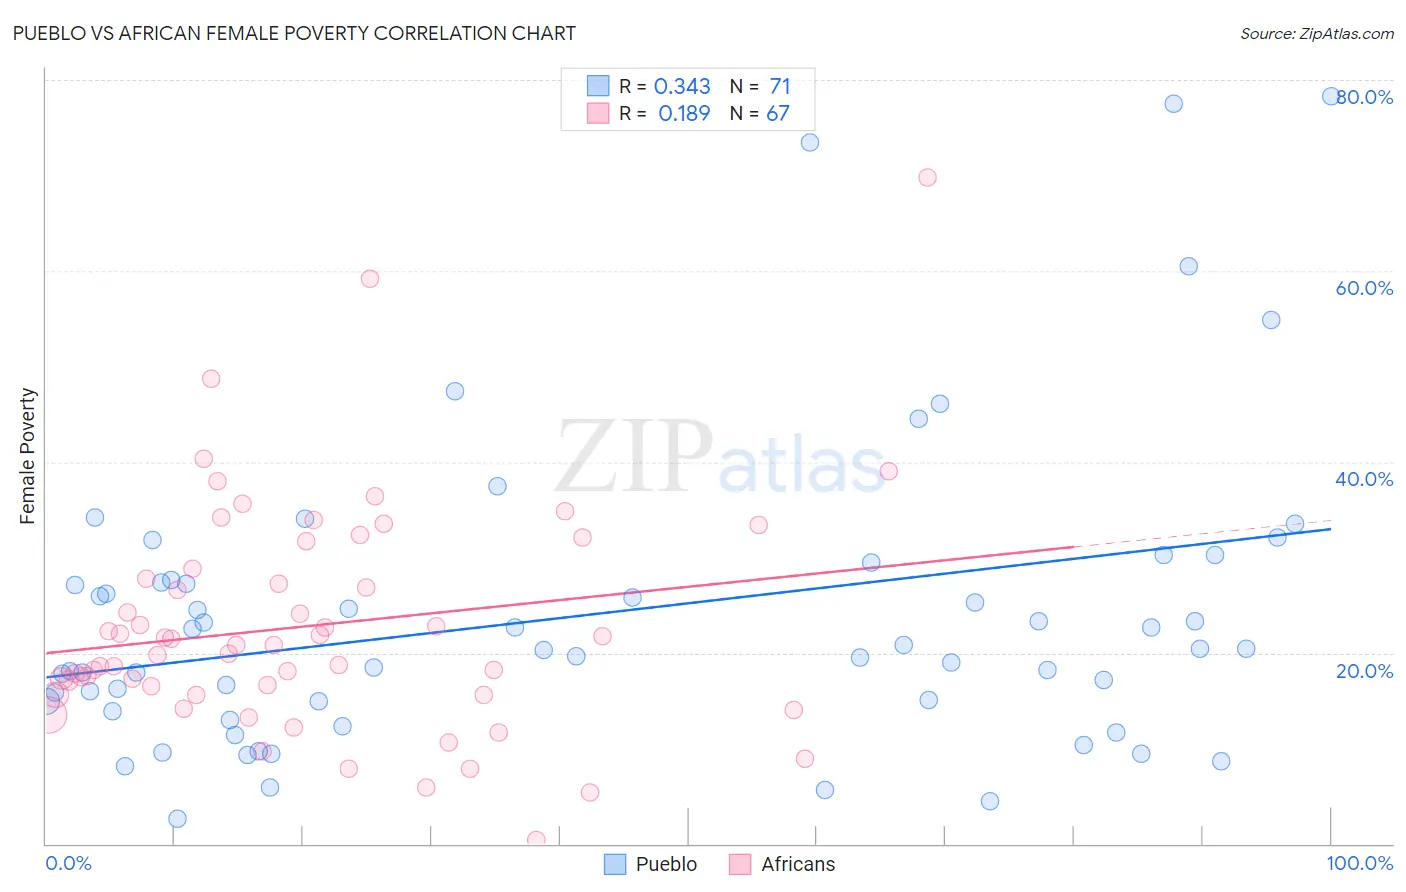
Pueblo vs African Female Poverty Correlation Chart
The statistical analysis conducted on geographies consisting of 120,063,316 people shows a mild positive correlation between the proportion of Pueblo and poverty level among females in the United States with a correlation coefficient (R) of 0.343 and weighted average of 20.7%. Similarly, the statistical analysis conducted on geographies consisting of 469,508,235 people shows a poor positive correlation between the proportion of Africans and poverty level among females in the United States with a correlation coefficient (R) of 0.189 and weighted average of 16.9%, a difference of 22.4%.
Female Poverty Correlation Summary
| Measurement | Pueblo | African |
| Minimum | 2.6% | 0.38% |
| Maximum | 78.3% | 69.8% |
| Range | 75.6% | 69.4% |
| Mean | 24.0% | 22.8% |
| Median | 20.4% | 20.8% |
| Interquartile 25% (IQ1) | 14.9% | 15.6% |
| Interquartile 75% (IQ3) | 27.6% | 28.8% |
| Interquartile Range (IQR) | 12.7% | 13.2% |
| Standard Deviation (Sample) | 15.8% | 12.0% |
| Standard Deviation (Population) | 15.7% | 11.9% |
Similar Demographics by Female Poverty
Demographics Similar to Pueblo by Female Poverty
In terms of female poverty, the demographic groups most similar to Pueblo are Yuman (20.8%, a difference of 0.81%), Sioux (20.9%, a difference of 1.0%), Hopi (21.0%, a difference of 1.4%), Cheyenne (20.2%, a difference of 2.4%), and Houma (20.0%, a difference of 3.2%).
| Demographics | Rating | Rank | Female Poverty |
| Kiowa | 0.0 /100 | #329 | Tragic 18.6% |
| Dominicans | 0.0 /100 | #330 | Tragic 19.1% |
| Natives/Alaskans | 0.0 /100 | #331 | Tragic 19.2% |
| Apache | 0.0 /100 | #332 | Tragic 19.2% |
| Immigrants | Dominican Republic | 0.0 /100 | #333 | Tragic 19.3% |
| Houma | 0.0 /100 | #334 | Tragic 20.0% |
| Cheyenne | 0.0 /100 | #335 | Tragic 20.2% |
| Pueblo | 0.0 /100 | #336 | Tragic 20.7% |
| Yuman | 0.0 /100 | #337 | Tragic 20.8% |
| Sioux | 0.0 /100 | #338 | Tragic 20.9% |
| Hopi | 0.0 /100 | #339 | Tragic 21.0% |
| Yup'ik | 0.0 /100 | #340 | Tragic 21.5% |
| Crow | 0.0 /100 | #341 | Tragic 22.1% |
| Immigrants | Yemen | 0.0 /100 | #342 | Tragic 22.8% |
| Lumbee | 0.0 /100 | #343 | Tragic 23.5% |
Demographics Similar to Africans by Female Poverty
In terms of female poverty, the demographic groups most similar to Africans are Seminole (16.9%, a difference of 0.060%), Immigrants from Caribbean (16.9%, a difference of 0.19%), Immigrants from Mexico (17.0%, a difference of 0.39%), Immigrants from Grenada (16.8%, a difference of 0.45%), and Immigrants from Central America (16.8%, a difference of 0.46%).
| Demographics | Rating | Rank | Female Poverty |
| Guatemalans | 0.0 /100 | #301 | Tragic 16.7% |
| Chippewa | 0.0 /100 | #302 | Tragic 16.7% |
| Choctaw | 0.0 /100 | #303 | Tragic 16.8% |
| Immigrants | Central America | 0.0 /100 | #304 | Tragic 16.8% |
| Immigrants | Grenada | 0.0 /100 | #305 | Tragic 16.8% |
| Immigrants | Caribbean | 0.0 /100 | #306 | Tragic 16.9% |
| Seminole | 0.0 /100 | #307 | Tragic 16.9% |
| Africans | 0.0 /100 | #308 | Tragic 16.9% |
| Immigrants | Mexico | 0.0 /100 | #309 | Tragic 17.0% |
| Creek | 0.0 /100 | #310 | Tragic 17.0% |
| Immigrants | Guatemala | 0.0 /100 | #311 | Tragic 17.0% |
| Immigrants | Somalia | 0.0 /100 | #312 | Tragic 17.0% |
| British West Indians | 0.0 /100 | #313 | Tragic 17.0% |
| Dutch West Indians | 0.0 /100 | #314 | Tragic 17.1% |
| U.S. Virgin Islanders | 0.0 /100 | #315 | Tragic 17.3% |