Lithuanian vs Cree Family Households with Children
COMPARE
Lithuanian
Cree
Family Households with Children
Family Households with Children Comparison
Lithuanians
Cree
26.6%
FAMILY HOUSEHOLDS WITH CHILDREN
0.3/ 100
METRIC RATING
281st/ 347
METRIC RANK
26.2%
FAMILY HOUSEHOLDS WITH CHILDREN
0.0/ 100
METRIC RATING
313th/ 347
METRIC RANK
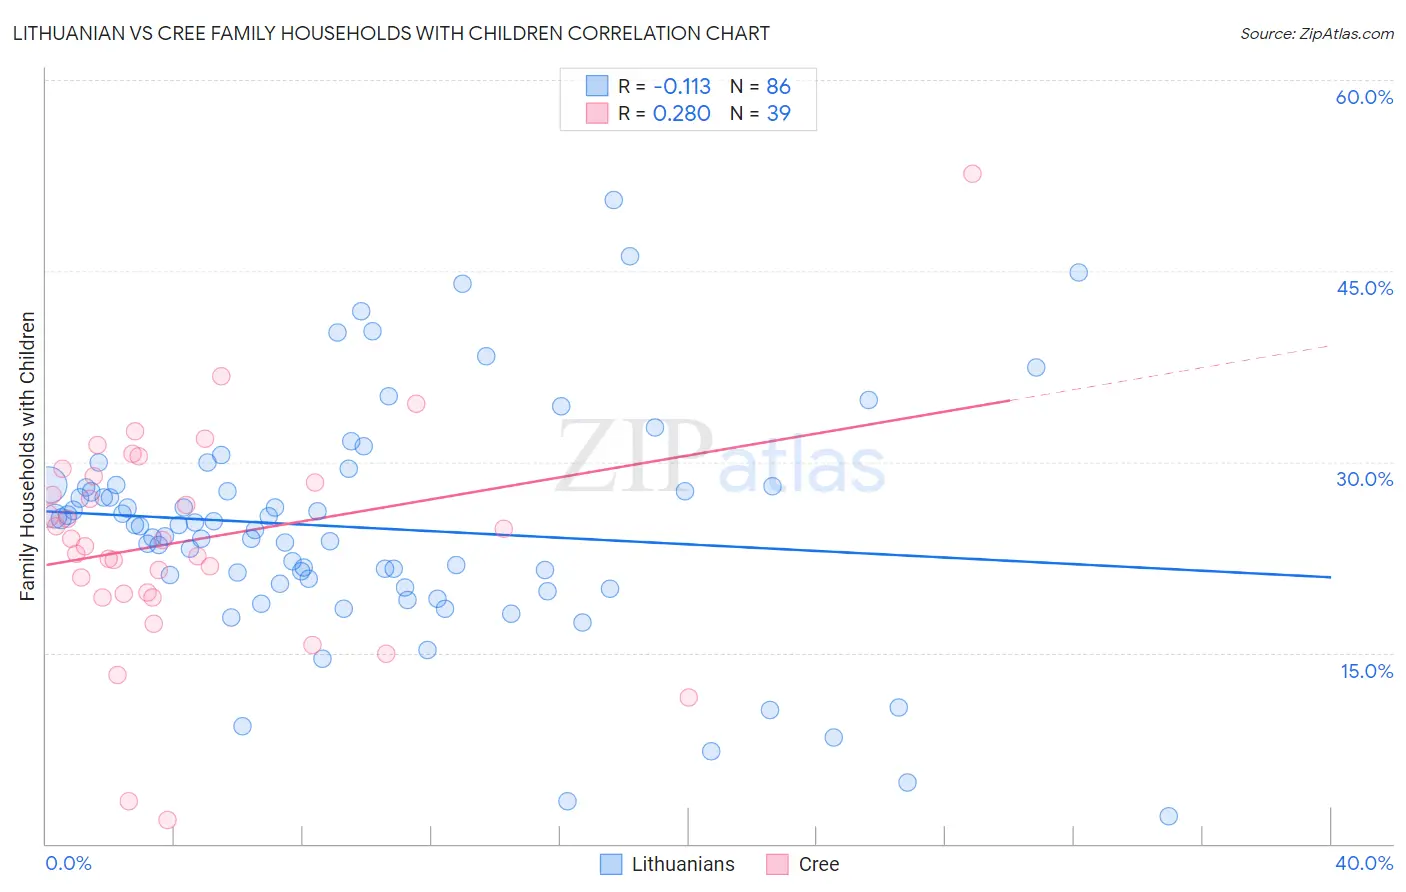
Lithuanian vs Cree Family Households with Children Correlation Chart
The statistical analysis conducted on geographies consisting of 421,521,006 people shows a poor negative correlation between the proportion of Lithuanians and percentage of family households with children in the United States with a correlation coefficient (R) of -0.113 and weighted average of 26.6%. Similarly, the statistical analysis conducted on geographies consisting of 76,201,254 people shows a weak positive correlation between the proportion of Cree and percentage of family households with children in the United States with a correlation coefficient (R) of 0.280 and weighted average of 26.2%, a difference of 1.6%.
Family Households with Children Correlation Summary
| Measurement | Lithuanian | Cree |
| Minimum | 2.2% | 1.9% |
| Maximum | 50.6% | 52.6% |
| Range | 48.4% | 50.7% |
| Mean | 24.8% | 23.9% |
| Median | 25.0% | 23.8% |
| Interquartile 25% (IQ1) | 20.4% | 19.6% |
| Interquartile 75% (IQ3) | 28.1% | 28.8% |
| Interquartile Range (IQR) | 7.7% | 9.2% |
| Standard Deviation (Sample) | 9.1% | 8.8% |
| Standard Deviation (Population) | 9.0% | 8.7% |
Similar Demographics by Family Households with Children
Demographics Similar to Lithuanians by Family Households with Children
In terms of family households with children, the demographic groups most similar to Lithuanians are French American Indian (26.6%, a difference of 0.010%), Immigrants from North America (26.6%, a difference of 0.080%), Senegalese (26.6%, a difference of 0.090%), Immigrants from Canada (26.5%, a difference of 0.10%), and Finnish (26.6%, a difference of 0.12%).
| Demographics | Rating | Rank | Family Households with Children |
| Eastern Europeans | 0.6 /100 | #274 | Tragic 26.7% |
| Immigrants | Northern Europe | 0.5 /100 | #275 | Tragic 26.7% |
| Immigrants | Spain | 0.5 /100 | #276 | Tragic 26.6% |
| Celtics | 0.4 /100 | #277 | Tragic 26.6% |
| Immigrants | Europe | 0.4 /100 | #278 | Tragic 26.6% |
| Finns | 0.4 /100 | #279 | Tragic 26.6% |
| Senegalese | 0.4 /100 | #280 | Tragic 26.6% |
| Lithuanians | 0.3 /100 | #281 | Tragic 26.6% |
| French American Indians | 0.3 /100 | #282 | Tragic 26.6% |
| Immigrants | North America | 0.3 /100 | #283 | Tragic 26.6% |
| Immigrants | Canada | 0.3 /100 | #284 | Tragic 26.5% |
| Cambodians | 0.2 /100 | #285 | Tragic 26.5% |
| Immigrants | Senegal | 0.2 /100 | #286 | Tragic 26.5% |
| Shoshone | 0.2 /100 | #287 | Tragic 26.5% |
| Russians | 0.2 /100 | #288 | Tragic 26.5% |
Demographics Similar to Cree by Family Households with Children
In terms of family households with children, the demographic groups most similar to Cree are French Canadian (26.1%, a difference of 0.080%), Immigrants from Norway (26.1%, a difference of 0.15%), Estonian (26.1%, a difference of 0.23%), Immigrants from Czechoslovakia (26.2%, a difference of 0.26%), and Colville (26.2%, a difference of 0.32%).
| Demographics | Rating | Rank | Family Households with Children |
| Bermudans | 0.1 /100 | #306 | Tragic 26.3% |
| West Indians | 0.0 /100 | #307 | Tragic 26.3% |
| Lumbee | 0.0 /100 | #308 | Tragic 26.3% |
| Immigrants | Somalia | 0.0 /100 | #309 | Tragic 26.3% |
| Marshallese | 0.0 /100 | #310 | Tragic 26.2% |
| Colville | 0.0 /100 | #311 | Tragic 26.2% |
| Immigrants | Czechoslovakia | 0.0 /100 | #312 | Tragic 26.2% |
| Cree | 0.0 /100 | #313 | Tragic 26.2% |
| French Canadians | 0.0 /100 | #314 | Tragic 26.1% |
| Immigrants | Norway | 0.0 /100 | #315 | Tragic 26.1% |
| Estonians | 0.0 /100 | #316 | Tragic 26.1% |
| Ottawa | 0.0 /100 | #317 | Tragic 26.1% |
| Iroquois | 0.0 /100 | #318 | Tragic 26.1% |
| Immigrants | France | 0.0 /100 | #319 | Tragic 26.0% |
| Tlingit-Haida | 0.0 /100 | #320 | Tragic 26.0% |