Lithuanian vs Cree No Schooling Completed
COMPARE
Lithuanian
Cree
No Schooling Completed
No Schooling Completed Comparison
Lithuanians
Cree
1.4%
NO SCHOOLING COMPLETED
100.0/ 100
METRIC RATING
11th/ 347
METRIC RANK
1.9%
NO SCHOOLING COMPLETED
94.5/ 100
METRIC RATING
122nd/ 347
METRIC RANK
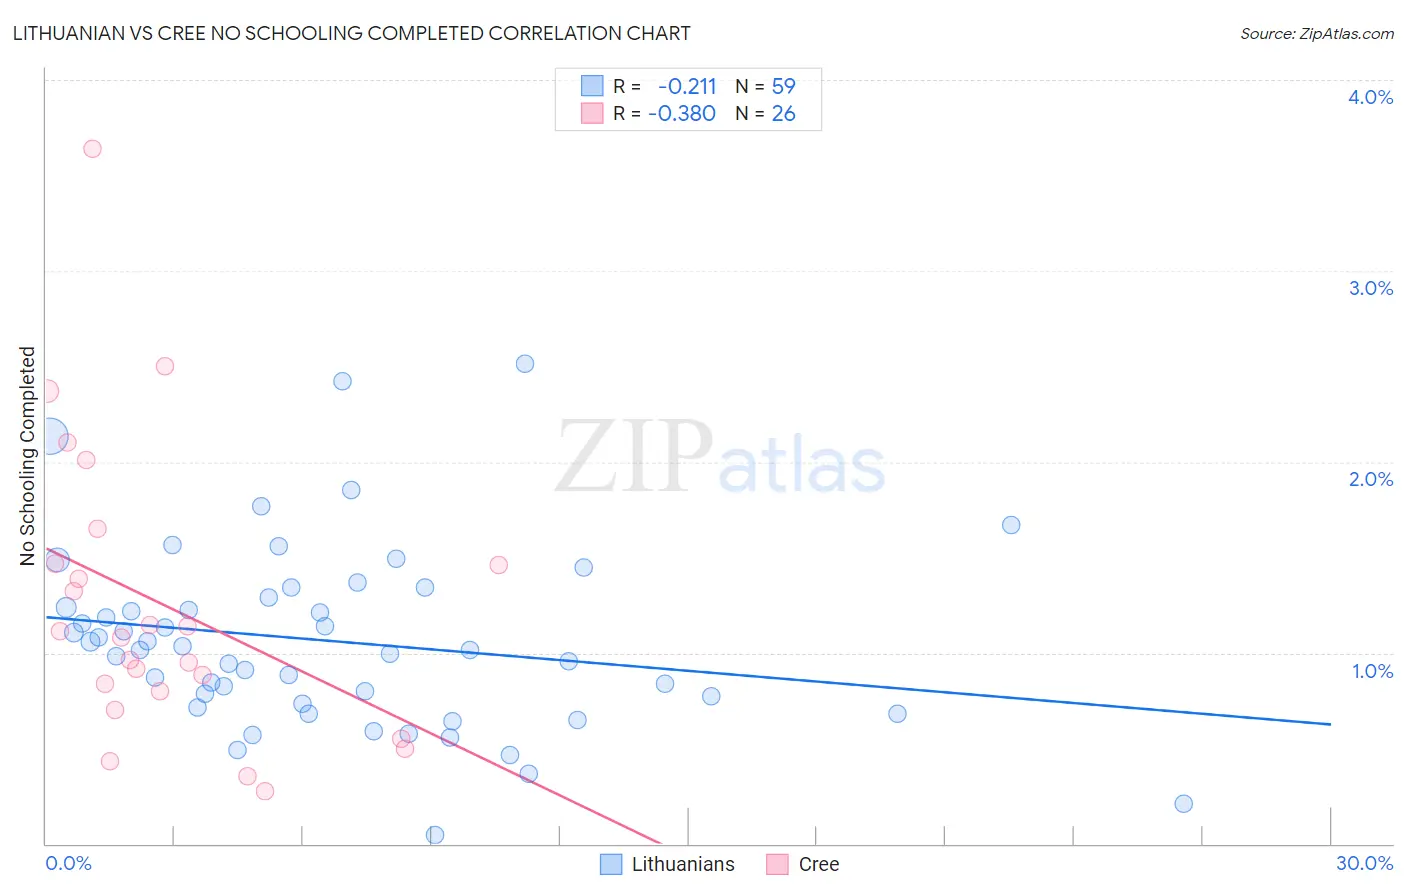
Lithuanian vs Cree No Schooling Completed Correlation Chart
The statistical analysis conducted on geographies consisting of 415,193,435 people shows a weak negative correlation between the proportion of Lithuanians and percentage of population with no schooling in the United States with a correlation coefficient (R) of -0.211 and weighted average of 1.4%. Similarly, the statistical analysis conducted on geographies consisting of 75,913,844 people shows a mild negative correlation between the proportion of Cree and percentage of population with no schooling in the United States with a correlation coefficient (R) of -0.380 and weighted average of 1.9%, a difference of 31.7%.
No Schooling Completed Correlation Summary
| Measurement | Lithuanian | Cree |
| Minimum | 0.047% | 0.28% |
| Maximum | 2.5% | 3.6% |
| Range | 2.5% | 3.4% |
| Mean | 1.1% | 1.3% |
| Median | 1.0% | 1.1% |
| Interquartile 25% (IQ1) | 0.74% | 0.80% |
| Interquartile 75% (IQ3) | 1.3% | 1.5% |
| Interquartile Range (IQR) | 0.55% | 0.67% |
| Standard Deviation (Sample) | 0.48% | 0.77% |
| Standard Deviation (Population) | 0.47% | 0.75% |
Similar Demographics by No Schooling Completed
Demographics Similar to Lithuanians by No Schooling Completed
In terms of no schooling completed, the demographic groups most similar to Lithuanians are Irish (1.4%, a difference of 0.030%), Polish (1.4%, a difference of 0.050%), Dutch (1.4%, a difference of 0.84%), Scotch-Irish (1.5%, a difference of 1.0%), and Tlingit-Haida (1.5%, a difference of 1.1%).
| Demographics | Rating | Rank | No Schooling Completed |
| Germans | 100.0 /100 | #4 | Exceptional 1.4% |
| Slovenes | 100.0 /100 | #5 | Exceptional 1.4% |
| Carpatho Rusyns | 100.0 /100 | #6 | Exceptional 1.4% |
| English | 100.0 /100 | #7 | Exceptional 1.4% |
| Swedes | 100.0 /100 | #8 | Exceptional 1.4% |
| Scottish | 100.0 /100 | #9 | Exceptional 1.4% |
| Dutch | 100.0 /100 | #10 | Exceptional 1.4% |
| Lithuanians | 100.0 /100 | #11 | Exceptional 1.4% |
| Irish | 100.0 /100 | #12 | Exceptional 1.4% |
| Poles | 100.0 /100 | #13 | Exceptional 1.4% |
| Scotch-Irish | 100.0 /100 | #14 | Exceptional 1.5% |
| Tlingit-Haida | 100.0 /100 | #15 | Exceptional 1.5% |
| Finns | 100.0 /100 | #16 | Exceptional 1.5% |
| Croatians | 100.0 /100 | #17 | Exceptional 1.5% |
| Danes | 100.0 /100 | #18 | Exceptional 1.5% |
Demographics Similar to Cree by No Schooling Completed
In terms of no schooling completed, the demographic groups most similar to Cree are Immigrants from Croatia (1.9%, a difference of 0.030%), Immigrants from Bulgaria (1.9%, a difference of 0.090%), Immigrants from Kuwait (1.9%, a difference of 0.36%), Cambodian (1.9%, a difference of 0.44%), and Iroquois (1.9%, a difference of 0.50%).
| Demographics | Rating | Rank | No Schooling Completed |
| Syrians | 96.0 /100 | #115 | Exceptional 1.9% |
| Lebanese | 96.0 /100 | #116 | Exceptional 1.9% |
| Immigrants | Serbia | 95.8 /100 | #117 | Exceptional 1.9% |
| Spanish | 95.5 /100 | #118 | Exceptional 1.9% |
| Iroquois | 95.1 /100 | #119 | Exceptional 1.9% |
| Immigrants | Bulgaria | 94.6 /100 | #120 | Exceptional 1.9% |
| Immigrants | Croatia | 94.5 /100 | #121 | Exceptional 1.9% |
| Cree | 94.5 /100 | #122 | Exceptional 1.9% |
| Immigrants | Kuwait | 93.9 /100 | #123 | Exceptional 1.9% |
| Cambodians | 93.8 /100 | #124 | Exceptional 1.9% |
| Immigrants | Europe | 93.7 /100 | #125 | Exceptional 1.9% |
| Immigrants | Romania | 92.6 /100 | #126 | Exceptional 1.9% |
| Israelis | 92.4 /100 | #127 | Exceptional 1.9% |
| Spaniards | 92.3 /100 | #128 | Exceptional 1.9% |
| Seminole | 92.0 /100 | #129 | Exceptional 1.9% |