Lithuanian vs Cree In Labor Force | Age 20-24
COMPARE
Lithuanian
Cree
In Labor Force | Age 20-24
In Labor Force | Age 20-24 Comparison
Lithuanians
Cree
77.0%
IN LABOR FORCE | AGE 20-24
99.9/ 100
METRIC RATING
63rd/ 347
METRIC RANK
76.6%
IN LABOR FORCE | AGE 20-24
99.7/ 100
METRIC RATING
74th/ 347
METRIC RANK
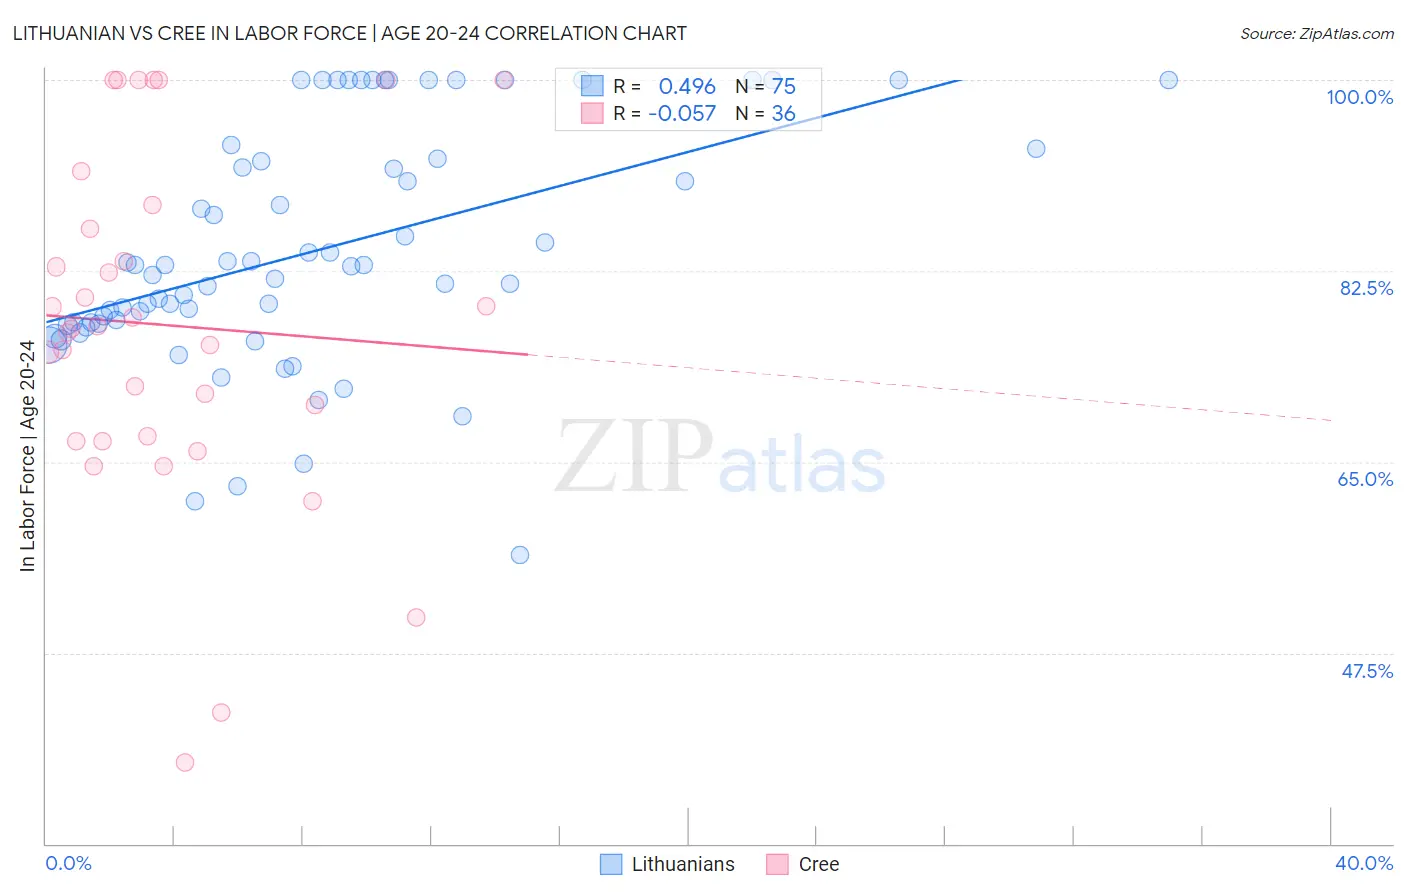
Lithuanian vs Cree In Labor Force | Age 20-24 Correlation Chart
The statistical analysis conducted on geographies consisting of 421,633,520 people shows a moderate positive correlation between the proportion of Lithuanians and labor force participation rate among population between the ages 20 and 24 in the United States with a correlation coefficient (R) of 0.496 and weighted average of 77.0%. Similarly, the statistical analysis conducted on geographies consisting of 76,182,817 people shows a slight negative correlation between the proportion of Cree and labor force participation rate among population between the ages 20 and 24 in the United States with a correlation coefficient (R) of -0.057 and weighted average of 76.6%, a difference of 0.40%.
In Labor Force | Age 20-24 Correlation Summary
| Measurement | Lithuanian | Cree |
| Minimum | 56.5% | 37.5% |
| Maximum | 100.0% | 100.0% |
| Range | 43.5% | 62.5% |
| Mean | 84.3% | 77.5% |
| Median | 82.9% | 77.3% |
| Interquartile 25% (IQ1) | 77.6% | 67.1% |
| Interquartile 75% (IQ3) | 92.8% | 87.4% |
| Interquartile Range (IQR) | 15.2% | 20.4% |
| Standard Deviation (Sample) | 10.8% | 15.9% |
| Standard Deviation (Population) | 10.7% | 15.6% |
Demographics Similar to Lithuanians and Cree by In Labor Force | Age 20-24
In terms of in labor force | age 20-24, the demographic groups most similar to Lithuanians are Immigrants from Kenya (77.0%, a difference of 0.0%), Immigrants from Eritrea (77.0%, a difference of 0.010%), White/Caucasian (76.9%, a difference of 0.040%), Kenyan (77.0%, a difference of 0.060%), and Scotch-Irish (77.0%, a difference of 0.090%). Similarly, the demographic groups most similar to Cree are Immigrants from Middle Africa (76.6%, a difference of 0.020%), Immigrants from Moldova (76.6%, a difference of 0.060%), British (76.7%, a difference of 0.070%), Immigrants from Cameroon (76.6%, a difference of 0.090%), and Canadian (76.6%, a difference of 0.090%).
| Demographics | Rating | Rank | In Labor Force | Age 20-24 |
| Hawaiians | 99.9 /100 | #58 | Exceptional 77.0% |
| Scotch-Irish | 99.9 /100 | #59 | Exceptional 77.0% |
| Kenyans | 99.9 /100 | #60 | Exceptional 77.0% |
| Immigrants | Eritrea | 99.9 /100 | #61 | Exceptional 77.0% |
| Immigrants | Kenya | 99.9 /100 | #62 | Exceptional 77.0% |
| Lithuanians | 99.9 /100 | #63 | Exceptional 77.0% |
| Whites/Caucasians | 99.9 /100 | #64 | Exceptional 76.9% |
| Crow | 99.9 /100 | #65 | Exceptional 76.9% |
| Icelanders | 99.9 /100 | #66 | Exceptional 76.9% |
| Slavs | 99.9 /100 | #67 | Exceptional 76.9% |
| French American Indians | 99.8 /100 | #68 | Exceptional 76.8% |
| Immigrants | Sudan | 99.8 /100 | #69 | Exceptional 76.8% |
| Ottawa | 99.8 /100 | #70 | Exceptional 76.8% |
| Northern Europeans | 99.8 /100 | #71 | Exceptional 76.8% |
| Guamanians/Chamorros | 99.8 /100 | #72 | Exceptional 76.7% |
| British | 99.8 /100 | #73 | Exceptional 76.7% |
| Cree | 99.7 /100 | #74 | Exceptional 76.6% |
| Immigrants | Middle Africa | 99.7 /100 | #75 | Exceptional 76.6% |
| Immigrants | Moldova | 99.6 /100 | #76 | Exceptional 76.6% |
| Immigrants | Cameroon | 99.6 /100 | #77 | Exceptional 76.6% |
| Canadians | 99.6 /100 | #78 | Exceptional 76.6% |