Lithuanian vs Cree Family Poverty
COMPARE
Lithuanian
Cree
Family Poverty
Family Poverty Comparison
Lithuanians
Cree
7.2%
FAMILY POVERTY
99.8/ 100
METRIC RATING
15th/ 347
METRIC RANK
10.5%
FAMILY POVERTY
0.7/ 100
METRIC RATING
244th/ 347
METRIC RANK
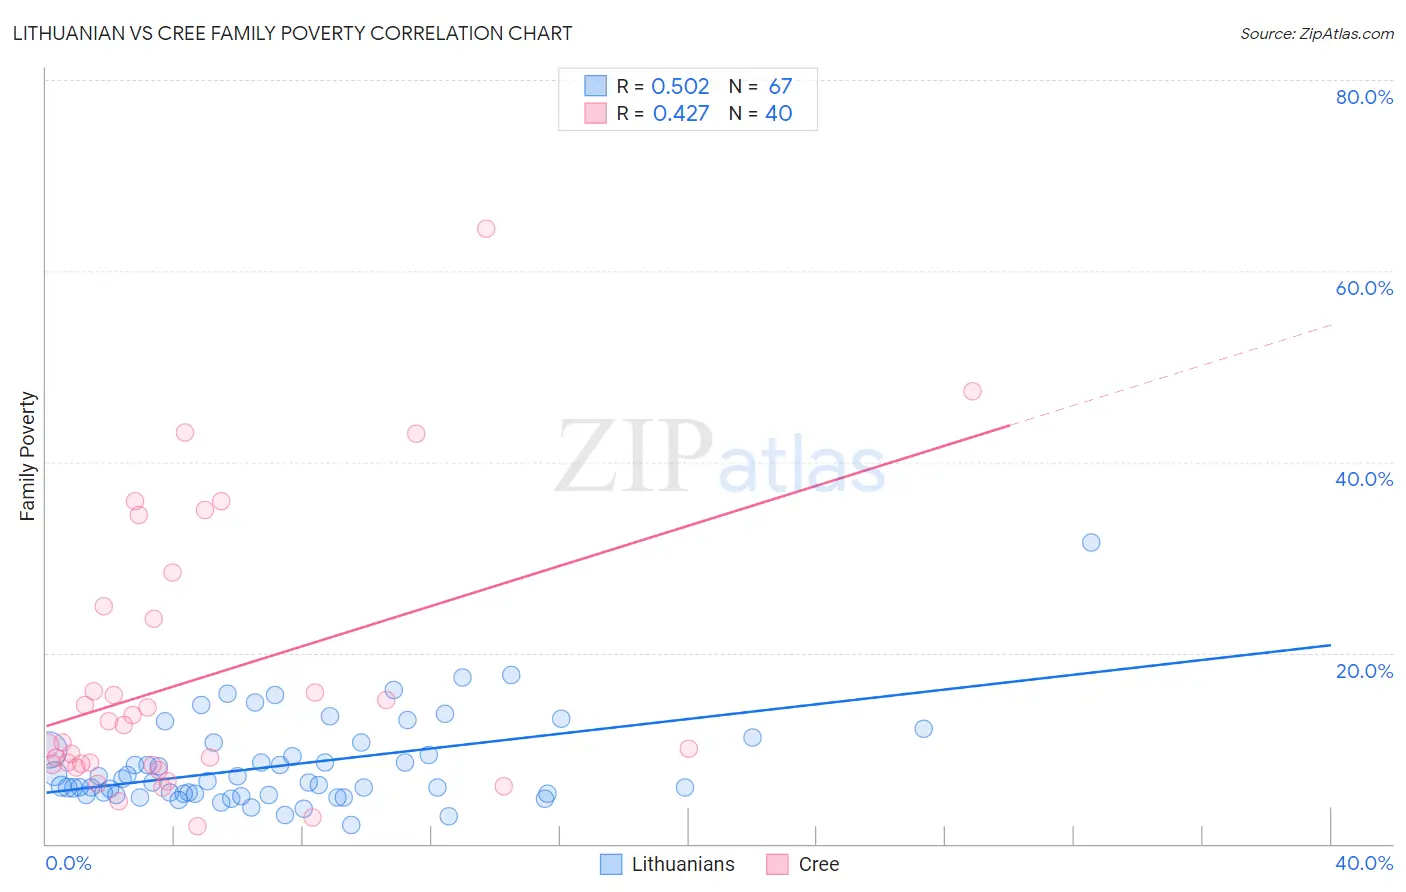
Lithuanian vs Cree Family Poverty Correlation Chart
The statistical analysis conducted on geographies consisting of 420,202,329 people shows a substantial positive correlation between the proportion of Lithuanians and poverty level among families in the United States with a correlation coefficient (R) of 0.502 and weighted average of 7.2%. Similarly, the statistical analysis conducted on geographies consisting of 76,172,191 people shows a moderate positive correlation between the proportion of Cree and poverty level among families in the United States with a correlation coefficient (R) of 0.427 and weighted average of 10.5%, a difference of 45.7%.
Family Poverty Correlation Summary
| Measurement | Lithuanian | Cree |
| Minimum | 2.0% | 1.8% |
| Maximum | 31.6% | 64.4% |
| Range | 29.6% | 62.6% |
| Mean | 8.3% | 17.4% |
| Median | 6.4% | 11.6% |
| Interquartile 25% (IQ1) | 5.2% | 8.3% |
| Interquartile 75% (IQ3) | 10.5% | 24.2% |
| Interquartile Range (IQR) | 5.3% | 16.0% |
| Standard Deviation (Sample) | 4.8% | 14.4% |
| Standard Deviation (Population) | 4.8% | 14.2% |
Similar Demographics by Family Poverty
Demographics Similar to Lithuanians by Family Poverty
In terms of family poverty, the demographic groups most similar to Lithuanians are Immigrants from South Central Asia (7.2%, a difference of 0.27%), Luxembourger (7.2%, a difference of 0.50%), Immigrants from Lithuania (7.2%, a difference of 0.51%), Eastern European (7.2%, a difference of 0.81%), and Swedish (7.1%, a difference of 0.88%).
| Demographics | Rating | Rank | Family Poverty |
| Bhutanese | 99.9 /100 | #8 | Exceptional 7.0% |
| Latvians | 99.9 /100 | #9 | Exceptional 7.1% |
| Bulgarians | 99.8 /100 | #10 | Exceptional 7.1% |
| Immigrants | Singapore | 99.8 /100 | #11 | Exceptional 7.1% |
| Maltese | 99.8 /100 | #12 | Exceptional 7.1% |
| Swedes | 99.8 /100 | #13 | Exceptional 7.1% |
| Iranians | 99.8 /100 | #14 | Exceptional 7.1% |
| Lithuanians | 99.8 /100 | #15 | Exceptional 7.2% |
| Immigrants | South Central Asia | 99.8 /100 | #16 | Exceptional 7.2% |
| Luxembourgers | 99.8 /100 | #17 | Exceptional 7.2% |
| Immigrants | Lithuania | 99.8 /100 | #18 | Exceptional 7.2% |
| Eastern Europeans | 99.7 /100 | #19 | Exceptional 7.2% |
| Immigrants | Hong Kong | 99.7 /100 | #20 | Exceptional 7.3% |
| Immigrants | Iran | 99.7 /100 | #21 | Exceptional 7.3% |
| Danes | 99.7 /100 | #22 | Exceptional 7.3% |
Demographics Similar to Cree by Family Poverty
In terms of family poverty, the demographic groups most similar to Cree are Nepalese (10.4%, a difference of 0.46%), Immigrants from Burma/Myanmar (10.5%, a difference of 0.61%), Alaska Native (10.4%, a difference of 0.94%), Cherokee (10.6%, a difference of 1.3%), and Liberian (10.6%, a difference of 1.3%).
| Demographics | Rating | Rank | Family Poverty |
| Immigrants | Laos | 1.7 /100 | #237 | Tragic 10.2% |
| French American Indians | 1.5 /100 | #238 | Tragic 10.2% |
| Potawatomi | 1.5 /100 | #239 | Tragic 10.2% |
| Immigrants | Azores | 1.4 /100 | #240 | Tragic 10.3% |
| Ghanaians | 1.3 /100 | #241 | Tragic 10.3% |
| Alaska Natives | 1.0 /100 | #242 | Tragic 10.4% |
| Nepalese | 0.8 /100 | #243 | Tragic 10.4% |
| Cree | 0.7 /100 | #244 | Tragic 10.5% |
| Immigrants | Burma/Myanmar | 0.6 /100 | #245 | Tragic 10.5% |
| Cherokee | 0.5 /100 | #246 | Tragic 10.6% |
| Liberians | 0.4 /100 | #247 | Tragic 10.6% |
| Nicaraguans | 0.4 /100 | #248 | Tragic 10.6% |
| Cubans | 0.4 /100 | #249 | Tragic 10.6% |
| Salvadorans | 0.3 /100 | #250 | Tragic 10.7% |
| Iroquois | 0.3 /100 | #251 | Tragic 10.7% |