Lithuanian vs Cree 8th Grade
COMPARE
Lithuanian
Cree
8th Grade
8th Grade Comparison
Lithuanians
Cree
97.3%
8TH GRADE
100.0/ 100
METRIC RATING
18th/ 347
METRIC RANK
96.4%
8TH GRADE
98.6/ 100
METRIC RATING
99th/ 347
METRIC RANK
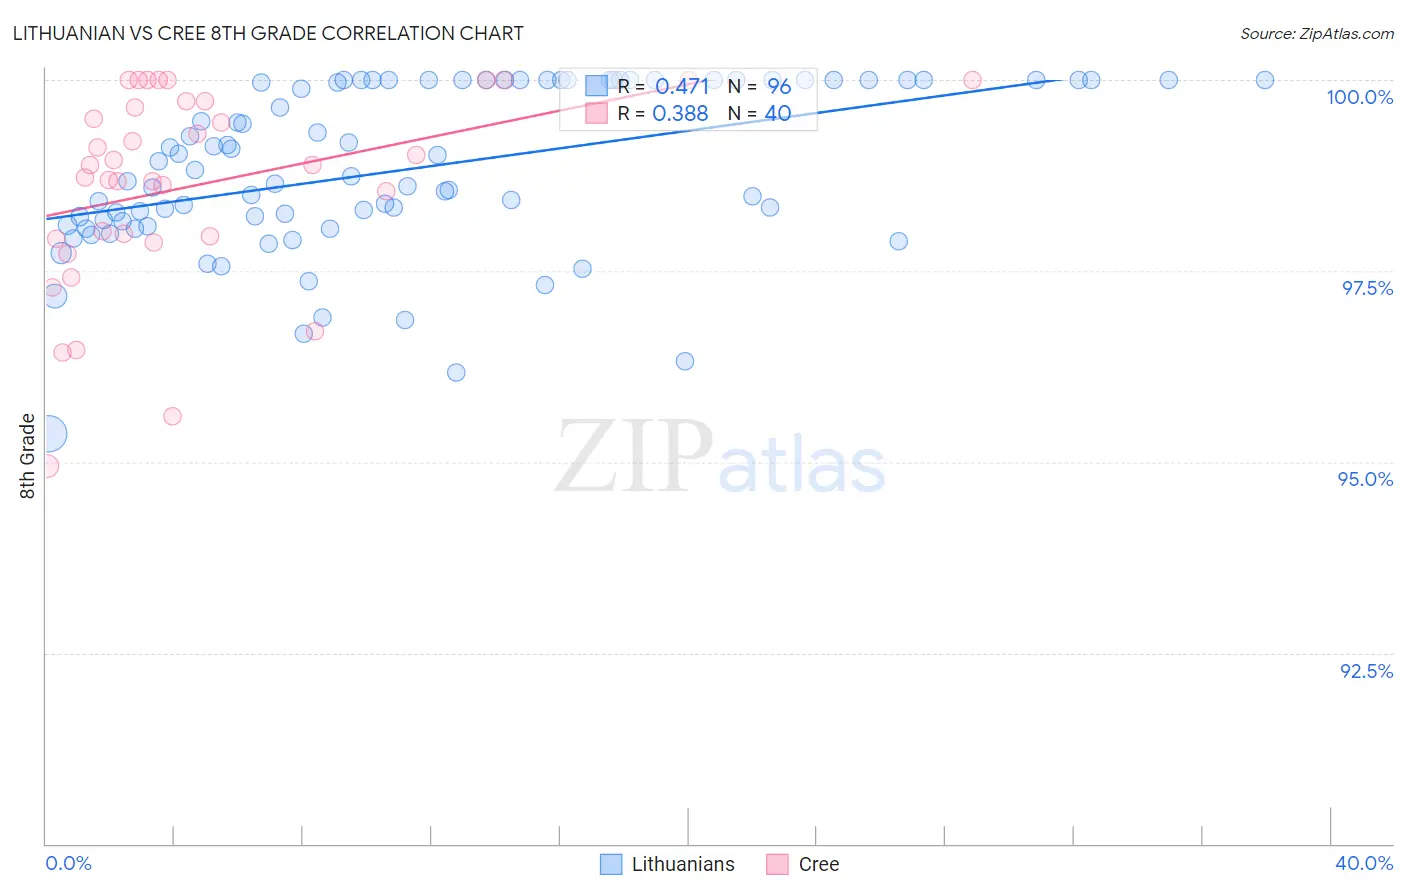
Lithuanian vs Cree 8th Grade Correlation Chart
The statistical analysis conducted on geographies consisting of 421,948,041 people shows a moderate positive correlation between the proportion of Lithuanians and percentage of population with at least 8th grade education in the United States with a correlation coefficient (R) of 0.471 and weighted average of 97.3%. Similarly, the statistical analysis conducted on geographies consisting of 76,204,399 people shows a mild positive correlation between the proportion of Cree and percentage of population with at least 8th grade education in the United States with a correlation coefficient (R) of 0.388 and weighted average of 96.4%, a difference of 0.91%.
8th Grade Correlation Summary
| Measurement | Lithuanian | Cree |
| Minimum | 95.4% | 94.9% |
| Maximum | 100.0% | 100.0% |
| Range | 4.6% | 5.1% |
| Mean | 98.8% | 98.6% |
| Median | 98.8% | 98.9% |
| Interquartile 25% (IQ1) | 98.1% | 97.9% |
| Interquartile 75% (IQ3) | 100.0% | 99.7% |
| Interquartile Range (IQR) | 1.9% | 1.8% |
| Standard Deviation (Sample) | 1.1% | 1.3% |
| Standard Deviation (Population) | 1.1% | 1.3% |
Similar Demographics by 8th Grade
Demographics Similar to Lithuanians by 8th Grade
In terms of 8th grade, the demographic groups most similar to Lithuanians are Irish (97.3%, a difference of 0.010%), Scottish (97.3%, a difference of 0.010%), Tlingit-Haida (97.3%, a difference of 0.020%), Pennsylvania German (97.3%, a difference of 0.050%), and Alaskan Athabascan (97.3%, a difference of 0.060%).
| Demographics | Rating | Rank | 8th Grade |
| Poles | 100.0 /100 | #11 | Exceptional 97.4% |
| Swedes | 100.0 /100 | #12 | Exceptional 97.4% |
| Alaskan Athabascans | 100.0 /100 | #13 | Exceptional 97.3% |
| English | 100.0 /100 | #14 | Exceptional 97.3% |
| Pennsylvania Germans | 100.0 /100 | #15 | Exceptional 97.3% |
| Tlingit-Haida | 100.0 /100 | #16 | Exceptional 97.3% |
| Irish | 100.0 /100 | #17 | Exceptional 97.3% |
| Lithuanians | 100.0 /100 | #18 | Exceptional 97.3% |
| Scottish | 100.0 /100 | #19 | Exceptional 97.3% |
| Croatians | 100.0 /100 | #20 | Exceptional 97.2% |
| Danes | 100.0 /100 | #21 | Exceptional 97.2% |
| Welsh | 100.0 /100 | #22 | Exceptional 97.2% |
| French Canadians | 100.0 /100 | #23 | Exceptional 97.2% |
| Scandinavians | 100.0 /100 | #24 | Exceptional 97.2% |
| Czechs | 100.0 /100 | #25 | Exceptional 97.1% |
Demographics Similar to Cree by 8th Grade
In terms of 8th grade, the demographic groups most similar to Cree are Osage (96.4%, a difference of 0.0%), Immigrants from Germany (96.4%, a difference of 0.0%), Potawatomi (96.4%, a difference of 0.010%), Immigrants from Czechoslovakia (96.4%, a difference of 0.010%), and Immigrants from Singapore (96.4%, a difference of 0.020%).
| Demographics | Rating | Rank | 8th Grade |
| Menominee | 98.9 /100 | #92 | Exceptional 96.4% |
| Immigrants | Denmark | 98.8 /100 | #93 | Exceptional 96.4% |
| Immigrants | Singapore | 98.8 /100 | #94 | Exceptional 96.4% |
| German Russians | 98.8 /100 | #95 | Exceptional 96.4% |
| Potawatomi | 98.7 /100 | #96 | Exceptional 96.4% |
| Osage | 98.7 /100 | #97 | Exceptional 96.4% |
| Immigrants | Germany | 98.7 /100 | #98 | Exceptional 96.4% |
| Cree | 98.6 /100 | #99 | Exceptional 96.4% |
| Immigrants | Czechoslovakia | 98.6 /100 | #100 | Exceptional 96.4% |
| Bhutanese | 98.2 /100 | #101 | Exceptional 96.4% |
| South Africans | 98.2 /100 | #102 | Exceptional 96.4% |
| Immigrants | Saudi Arabia | 98.0 /100 | #103 | Exceptional 96.3% |
| Kiowa | 98.0 /100 | #104 | Exceptional 96.3% |
| Immigrants | North Macedonia | 98.0 /100 | #105 | Exceptional 96.3% |
| Okinawans | 98.0 /100 | #106 | Exceptional 96.3% |