Irish vs Macedonian Single Female Poverty
COMPARE
Irish
Macedonian
Single Female Poverty
Single Female Poverty Comparison
Irish
Macedonians
21.4%
SINGLE FEMALE POVERTY
21.4/ 100
METRIC RATING
200th/ 347
METRIC RANK
18.9%
SINGLE FEMALE POVERTY
99.8/ 100
METRIC RATING
46th/ 347
METRIC RANK
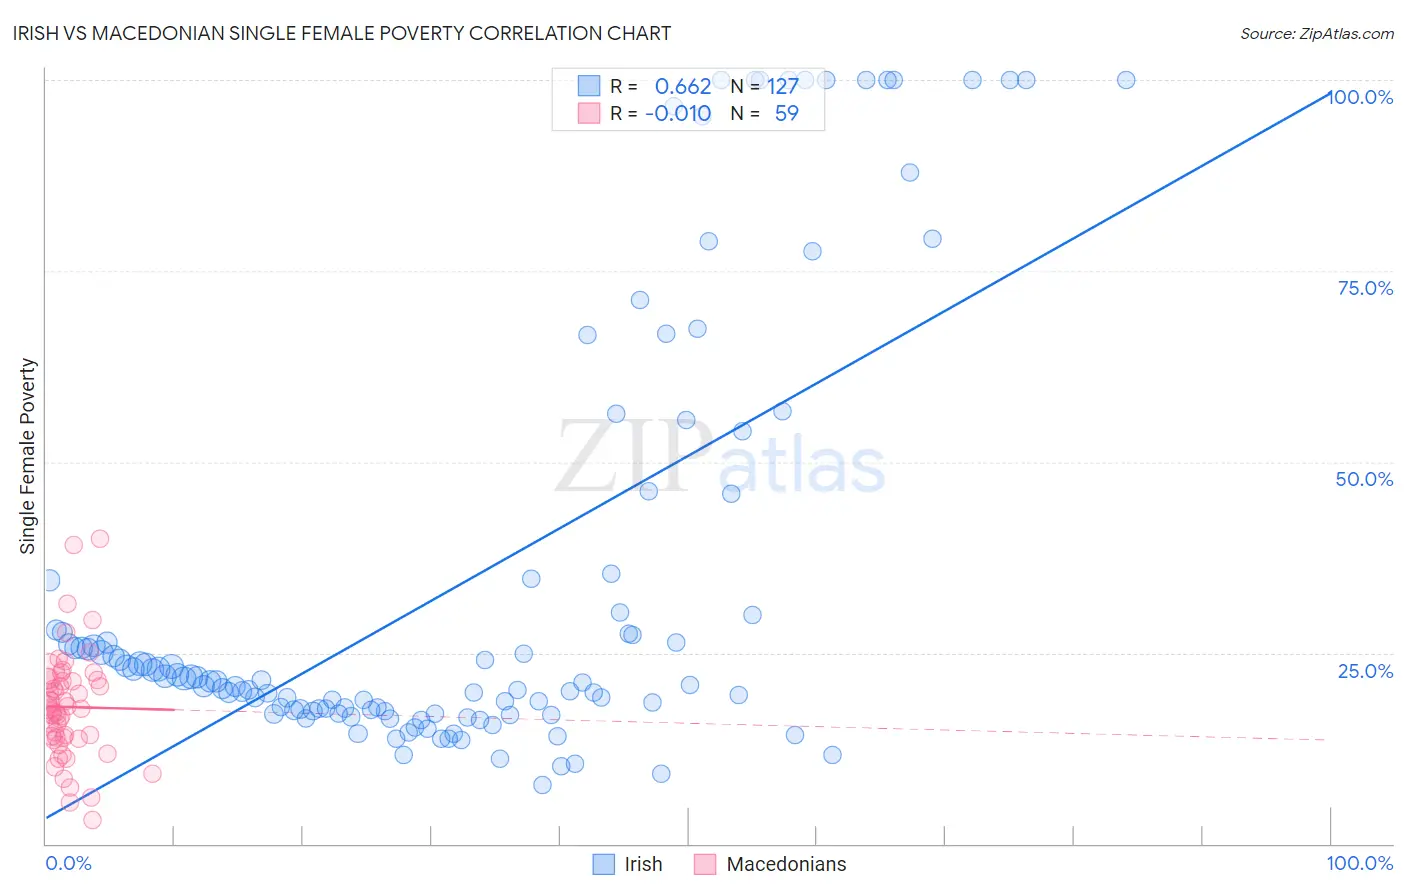
Irish vs Macedonian Single Female Poverty Correlation Chart
The statistical analysis conducted on geographies consisting of 557,675,928 people shows a significant positive correlation between the proportion of Irish and poverty level among single females in the United States with a correlation coefficient (R) of 0.662 and weighted average of 21.4%. Similarly, the statistical analysis conducted on geographies consisting of 131,464,116 people shows no correlation between the proportion of Macedonians and poverty level among single females in the United States with a correlation coefficient (R) of -0.010 and weighted average of 18.9%, a difference of 13.1%.
Single Female Poverty Correlation Summary
| Measurement | Irish | Macedonian |
| Minimum | 7.7% | 3.0% |
| Maximum | 100.0% | 40.0% |
| Range | 92.3% | 37.0% |
| Mean | 34.3% | 17.9% |
| Median | 21.2% | 17.6% |
| Interquartile 25% (IQ1) | 17.4% | 13.9% |
| Interquartile 75% (IQ3) | 34.5% | 21.4% |
| Interquartile Range (IQR) | 17.1% | 7.5% |
| Standard Deviation (Sample) | 28.5% | 7.0% |
| Standard Deviation (Population) | 28.4% | 6.9% |
Similar Demographics by Single Female Poverty
Demographics Similar to Irish by Single Female Poverty
In terms of single female poverty, the demographic groups most similar to Irish are Nigerian (21.4%, a difference of 0.040%), Immigrants (21.4%, a difference of 0.050%), Immigrants from Kenya (21.4%, a difference of 0.070%), Swiss (21.4%, a difference of 0.25%), and Immigrants from Haiti (21.5%, a difference of 0.25%).
| Demographics | Rating | Rank | Single Female Poverty |
| Basques | 28.1 /100 | #193 | Fair 21.3% |
| Czechoslovakians | 27.7 /100 | #194 | Fair 21.3% |
| Nicaraguans | 27.6 /100 | #195 | Fair 21.3% |
| Immigrants | Saudi Arabia | 27.1 /100 | #196 | Fair 21.3% |
| Japanese | 26.4 /100 | #197 | Fair 21.3% |
| Swiss | 24.2 /100 | #198 | Fair 21.4% |
| Immigrants | Immigrants | 22.0 /100 | #199 | Fair 21.4% |
| Irish | 21.4 /100 | #200 | Fair 21.4% |
| Nigerians | 20.9 /100 | #201 | Fair 21.4% |
| Immigrants | Kenya | 20.7 /100 | #202 | Fair 21.4% |
| Immigrants | Haiti | 18.8 /100 | #203 | Poor 21.5% |
| Immigrants | Africa | 16.7 /100 | #204 | Poor 21.5% |
| Finns | 16.2 /100 | #205 | Poor 21.5% |
| Belgians | 16.1 /100 | #206 | Poor 21.5% |
| Ghanaians | 15.7 /100 | #207 | Poor 21.6% |
Demographics Similar to Macedonians by Single Female Poverty
In terms of single female poverty, the demographic groups most similar to Macedonians are Immigrants from Indonesia (18.9%, a difference of 0.16%), Latvian (19.0%, a difference of 0.19%), Immigrants from Croatia (18.9%, a difference of 0.38%), Immigrants from Argentina (19.0%, a difference of 0.46%), and Immigrants from Czechoslovakia (19.0%, a difference of 0.47%).
| Demographics | Rating | Rank | Single Female Poverty |
| Bulgarians | 99.9 /100 | #39 | Exceptional 18.8% |
| Okinawans | 99.9 /100 | #40 | Exceptional 18.8% |
| Immigrants | Serbia | 99.9 /100 | #41 | Exceptional 18.8% |
| Jordanians | 99.9 /100 | #42 | Exceptional 18.8% |
| Immigrants | Romania | 99.9 /100 | #43 | Exceptional 18.8% |
| Immigrants | Croatia | 99.9 /100 | #44 | Exceptional 18.9% |
| Immigrants | Indonesia | 99.8 /100 | #45 | Exceptional 18.9% |
| Macedonians | 99.8 /100 | #46 | Exceptional 18.9% |
| Latvians | 99.8 /100 | #47 | Exceptional 19.0% |
| Immigrants | Argentina | 99.8 /100 | #48 | Exceptional 19.0% |
| Immigrants | Czechoslovakia | 99.8 /100 | #49 | Exceptional 19.0% |
| Immigrants | Eastern Europe | 99.8 /100 | #50 | Exceptional 19.0% |
| Immigrants | Italy | 99.8 /100 | #51 | Exceptional 19.0% |
| Egyptians | 99.7 /100 | #52 | Exceptional 19.1% |
| Tsimshian | 99.7 /100 | #53 | Exceptional 19.1% |